Alpha Release
This initial, limited availability release includes the following basic monitoring and alerting features of the Observability module.
Features
- Event capture: Observability collects and displays event information of what happened during each run of a monitoring pipeline.
- Pipeline creation: The platform can auto-create monitoring pipelines in the web app from event information.
- Pipeline runs: The platform auto-generates runs from event information.
- Alerts: Observability can send email alerts for the standard task statuses—running, completed, completed with warnings, failed, pending, not run, missing, incomplete.
Note: This release does not include the ability to set expectations and compare them against actual runs.
APIs
Refer to the following API documentation for information on API endpoints.
- Event Ingestion API: For posting events to the platform from external tools. See https://api.docs.datakitchen.io/production/events.html
- Observability API: For performing user and observability management tasks.
Web App
This release of the Observability web app includes a project overview page, a pipeline list and pipeline details pages, and a run list and run details pages.
See the descriptions below, and reveal/hide the sample images for a complete picture of this release.
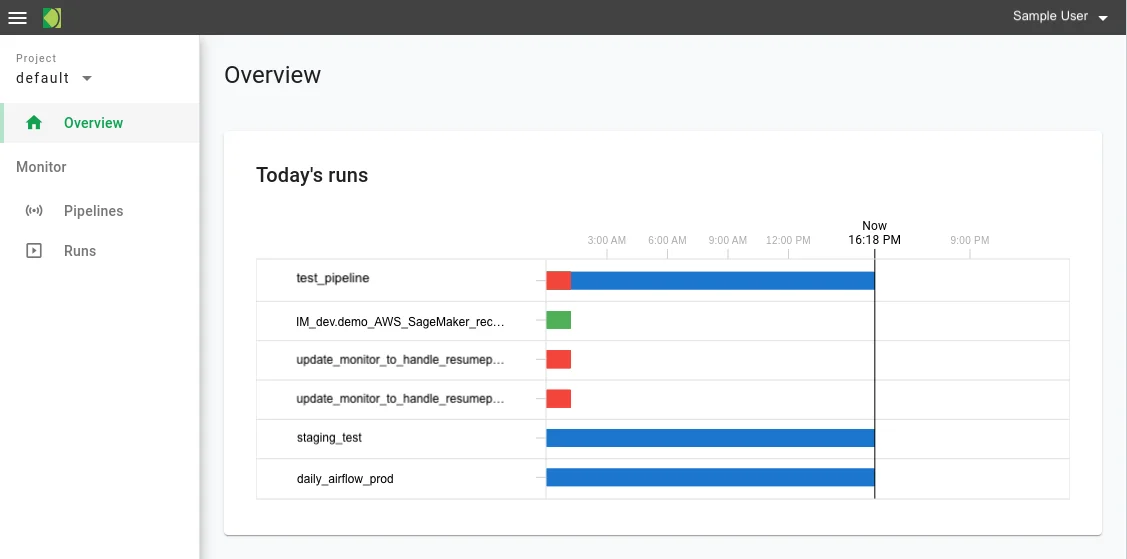
Project Overview page
- Gantt chart of Today's Runs by pipeline. See Project Overview for details.
- Links to related Run Details pages
Sample Overview page
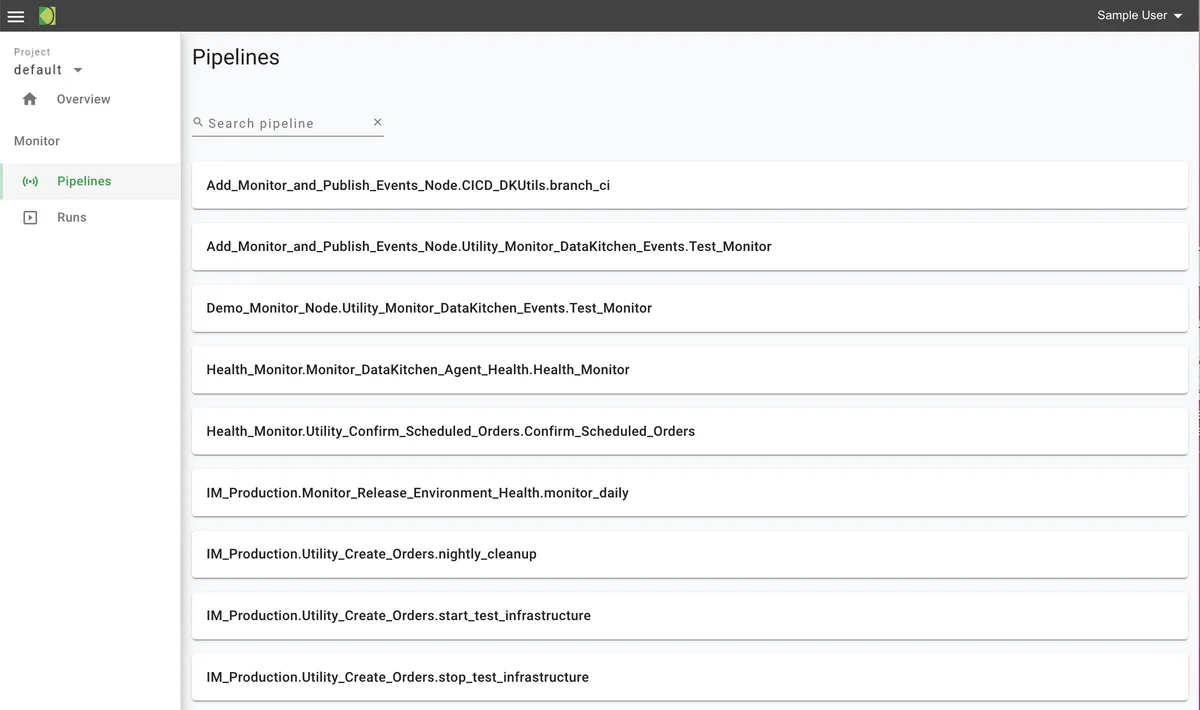
Pipelines page
- List of all pipelines created in the project. See Pipelines for details.
- Links to view Pipeline Details pages
Sample Pipelines page
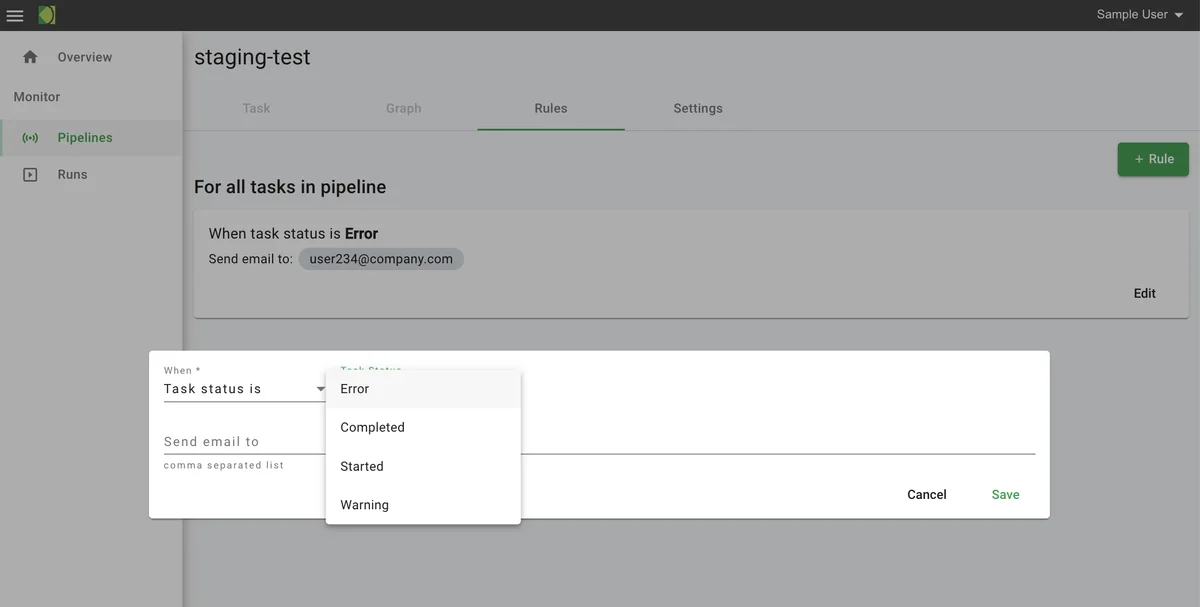
Pipeline Details page
- Settings tab: pipeline name may be edited.
- Rules tab: Users can add and edit rules. This release supports task status rules only, for example, "when task status is failure, send email to devops@company.com"
- Additional tabs: not available
Sample Pipeline Details page (two tabs)
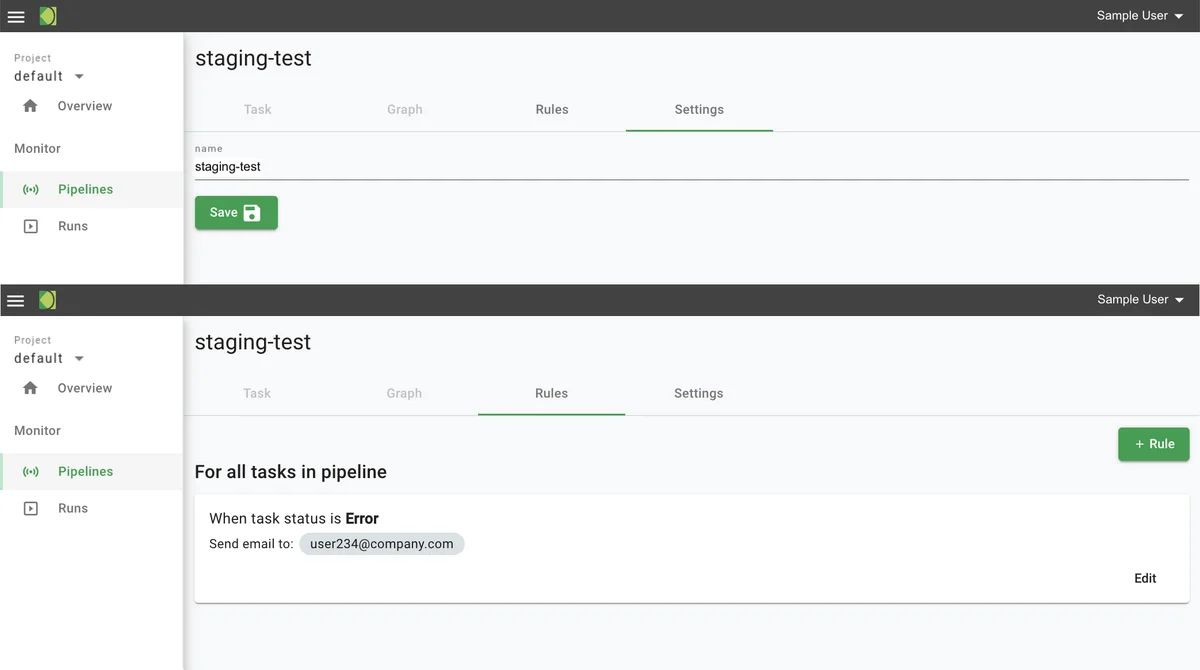
Sample Pipeline Details > Add Rules dialog
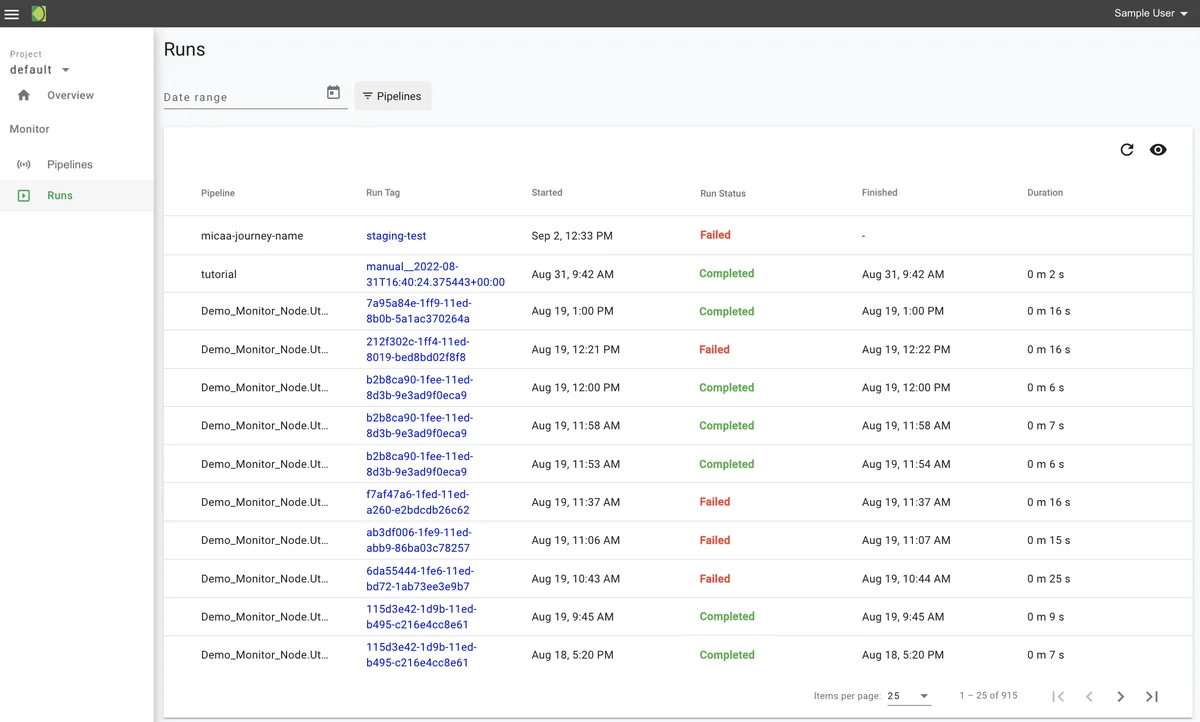
Runs page
- List of all runs, by pipeline, that started for the project. See Runs for more details.
- Run data includes pipeline name, run start and end times, run duration, and status
- List can be filtered on pipeline and date range
- Run status includes the number of tasks in each standard state—failure, warning, success
- Run tags are links to the related Run Details pages
Sample Runs page
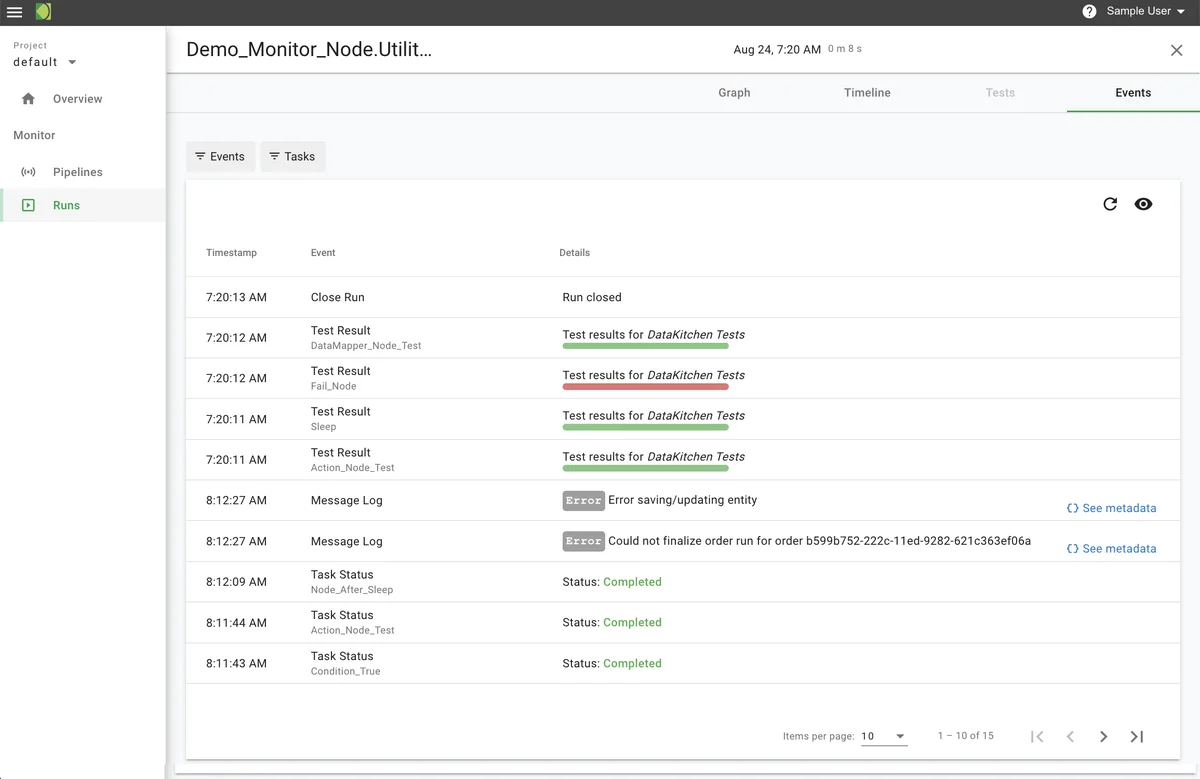
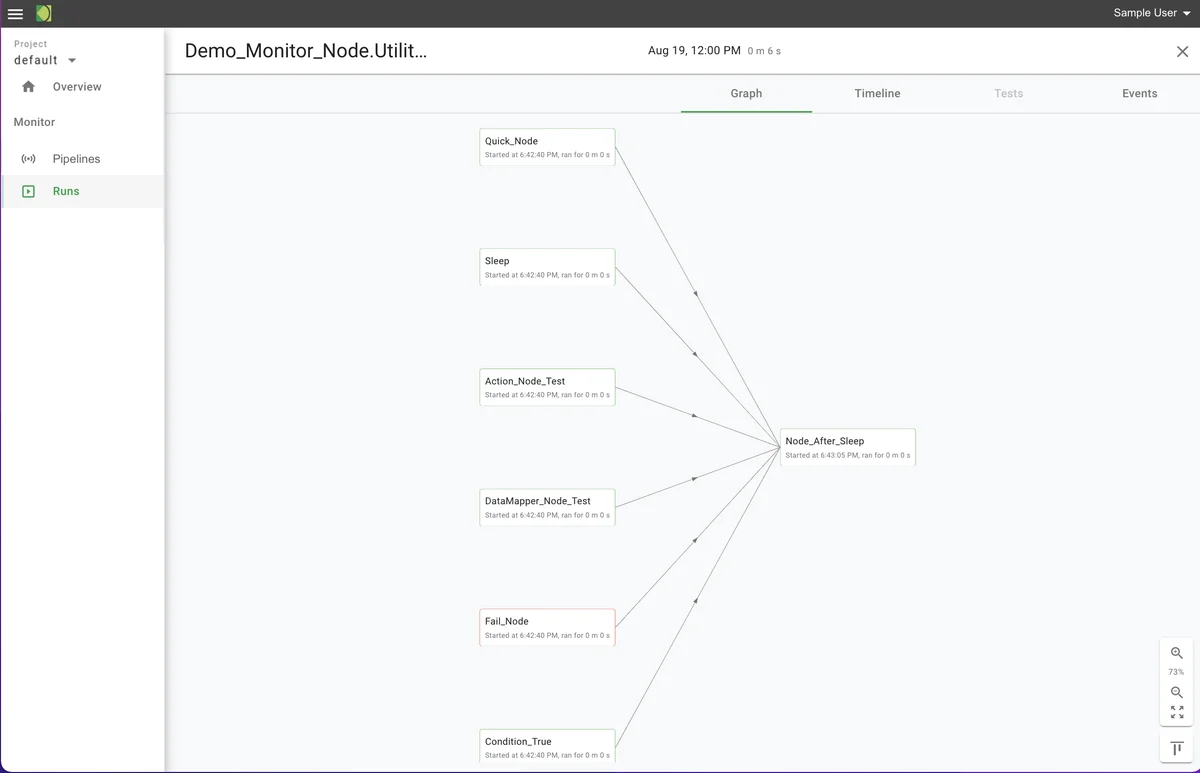
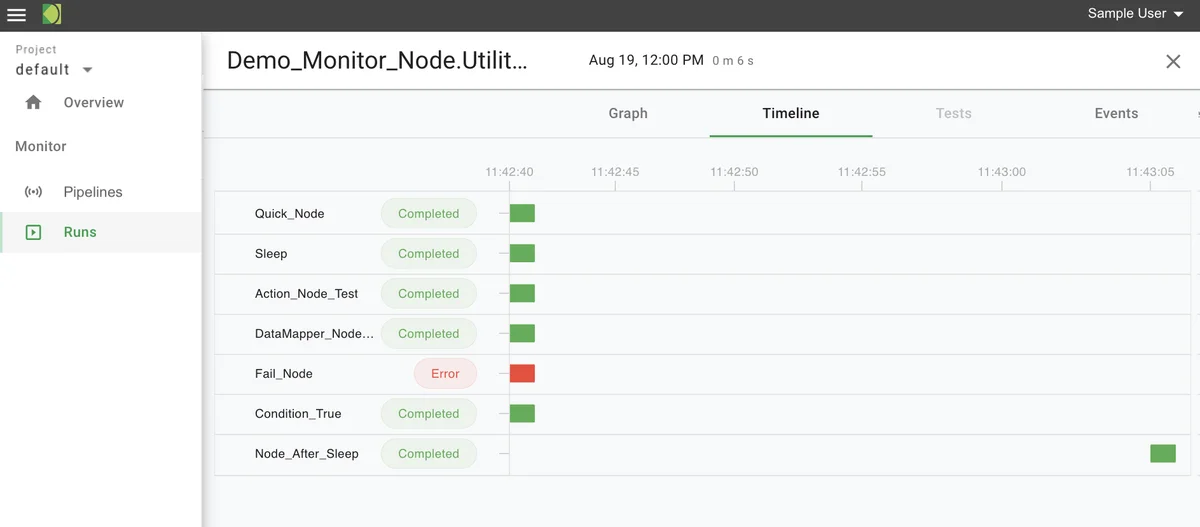
Run details page
- Events tab: list of events that occurred in the run; list can be filtered by task. See View Run Details.
- Timeline tab: Gantt chart shows the relative start, end, and duration times of each task in the run
This release of the timeline does not include expected timings or task dependencies. - Graph tab: a DAG (directed acyclic graph) shows the actual sequence of tasks in the run, automatically inferred by the relative timings of the tasks - Tests tab: not available
Sample Run Details > Graph tab
Sample Run Details > Timeline tab
Sample Run Details > Events tab