10 Minutes To Profile, Test, And Score Data Quality In Azure SQL Database or Synapse Analytics
Use this guide as an example of how to set up and use open-source DataOps Data Quality TestGen to profile, test, and score the quality of your data in an Azure SQL or Synapse database. Automatically define and catch data quality issues to prevent negative downstream impact.
(Not quite ready for this? Try parts one and part two of the self-contained Quickstart first)
Total Time Commitment:
- Prerequisites: Install DataOps Data Quality TestGen (5 mins, depending on your internet speed), Load Azure Demo Data (5 mins)
- 10 Minutes To Profile, Test, And Score Data Quality In Postgres: Setup Connection (1 min), Profiling, Hygiene Issues, Data Catalog (5 mins), Generate And Run Tests (2 min), View Test Results and Data Quality Scoreboard (2 mins)
About This Guide
Ah, the data quality crisis. It's that moment when your carefully crafted databases start spewing out numbers that make as much sense as a cat trying to bark. You know you're in trouble when the finance team uses your reports as modern art installations rather than decision-making tools. But fear not, fellow data wranglers! We've all been there; there's a way out of this crisis of lousy data.
Suppose you are a data engineer, data quality leader, responsible for data governance, or anyone who cares about data. In that case, you know the havoc a data quality crisis can create in your organization. The solution is to check your data for problems before your customers see it. That sounds easy, yet ensuring data quality is both essential and overwhelming. The sheer volume of tables, the complexity of the data usage, and the volume of work make manual test writing an overwhelming task. Everyone wants to write more tests, but they never get it done. Current open-source frameworks like YAML-based Soda Core, Python-based Great Expectations, and templatized dbt SQL are frameworks to help speed up the coding of data quality tests. They are all speed of coding using domain-specific language (DSL) to help you write data quality tests.
The data engineer's job is to ensure reliable, high-quality data pipelines that fuel analytics, machine learning, and operational use cases. But there's a growing problem--data quality testing is becoming an unsustainable burden. You don't have the time to write exhaustive data quality tests, and even if you did, you lack full context on business data usage. Meanwhile, business data stewards don't have the skills to program or even tweak these tests. The reality is that 80% of data quality tests can be generated automatically, eliminating the need for tedious manual coding. The solution? An open-source AI-driven data quality testing that learns from your data automatically while providing a simple UI, not a code-specific DSL, to review, improve, and manage your data quality test estate. Don't write tests -- use an intelligent Data Quality Test Generator.
For context, this guide presents an example of a Data Engineer at a small firm tasked with ensuring the quality and correctness of the AdventureWorks data in Postgres.
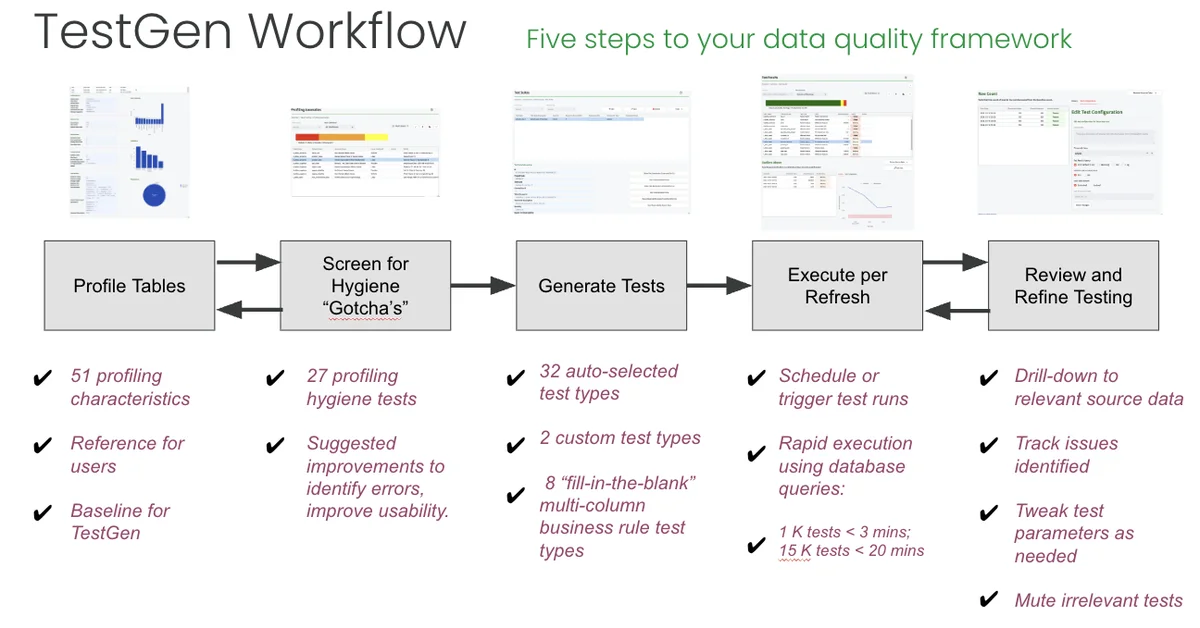
After investing just 10 minutes with TestGen in this quickstart, you get a data catalog, profiles on the data, a list of data hygiene issues, and automatically generated tests that you can use to monitor data quality; the results of the first run of those tests, and a data quality scoreboard.
Install DataOps Data Quality TestGen
Please install the appropriate open-source version of DataOps TestGen to follow the quick start guide to explore its features and capabilities. Complete the prerequisites, installation, and demo setup steps described in Install TestGen on Windows or Install TestGen on Mac/Linux or, if you are an expert, install via Python 'pip install.' If you are brand new, follow our Quick Start demo tutorial for a walk-through of the software.
Make An Azure SQL Database or Azure Synapse Analytics Database With Sample Data
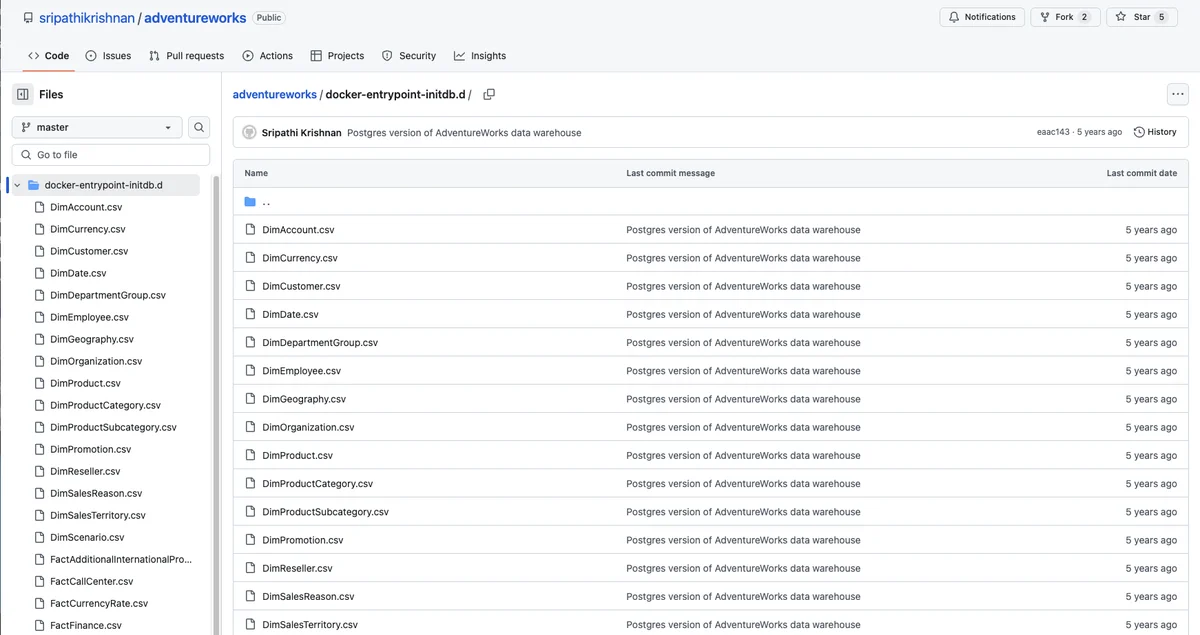
To enable you to use this walk-through, you must load data into Azure SQL Database or Synapse Analytics. Then, you can use TestGen against that data to run profiling/testing for data quality. The example data source contains a data warehouse for AdventureWorks, an imaginary online e-commerce organization. Microsoft created the AdventureWorks data warehouse example data. In this example, we use a handy Github repository from Sripathi that contains all the files we need with AdventureWorks data. Please go to this link, do a git pull of the repo, and download all the data files to your local machine.
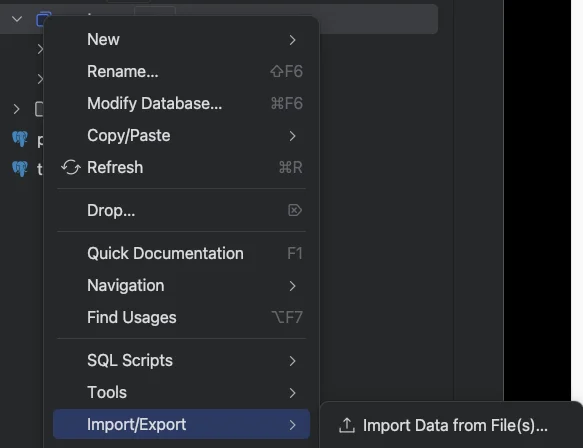
Once the data is on your machine, you must load it into Azure SQL Database or Synapse Analytics tables. A straightforward way is to use an open-source database tool to load the CSV files automatically into a Azure SQL Database or Azure Synapse Analytics. Here is an example of the utility from Pycharms to automatically load data into a database and create tables from CSV files.
Once you have loaded all the tables into Azure SQL Database or Synapse Analytics, you can begin with TestGen.
Connect TestGen To Azure SQL Database or Azure Synapse Analytics Database
You must connect TestGen to your Azure SQL Database or Azure Synapse Analytics database. First, navigate to the 'Connections' link on the left navigation bar of TestGen, and you will see a list of connections; then click on the '+ Add Connection' box in the upper right, and you will see the following dialog box:
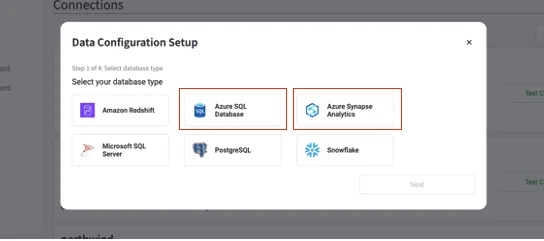
Click on the 'Azure SQL Database or Azure Synapse Analytics' box, and you will be taken to a dialog box to configure the connection to the database.
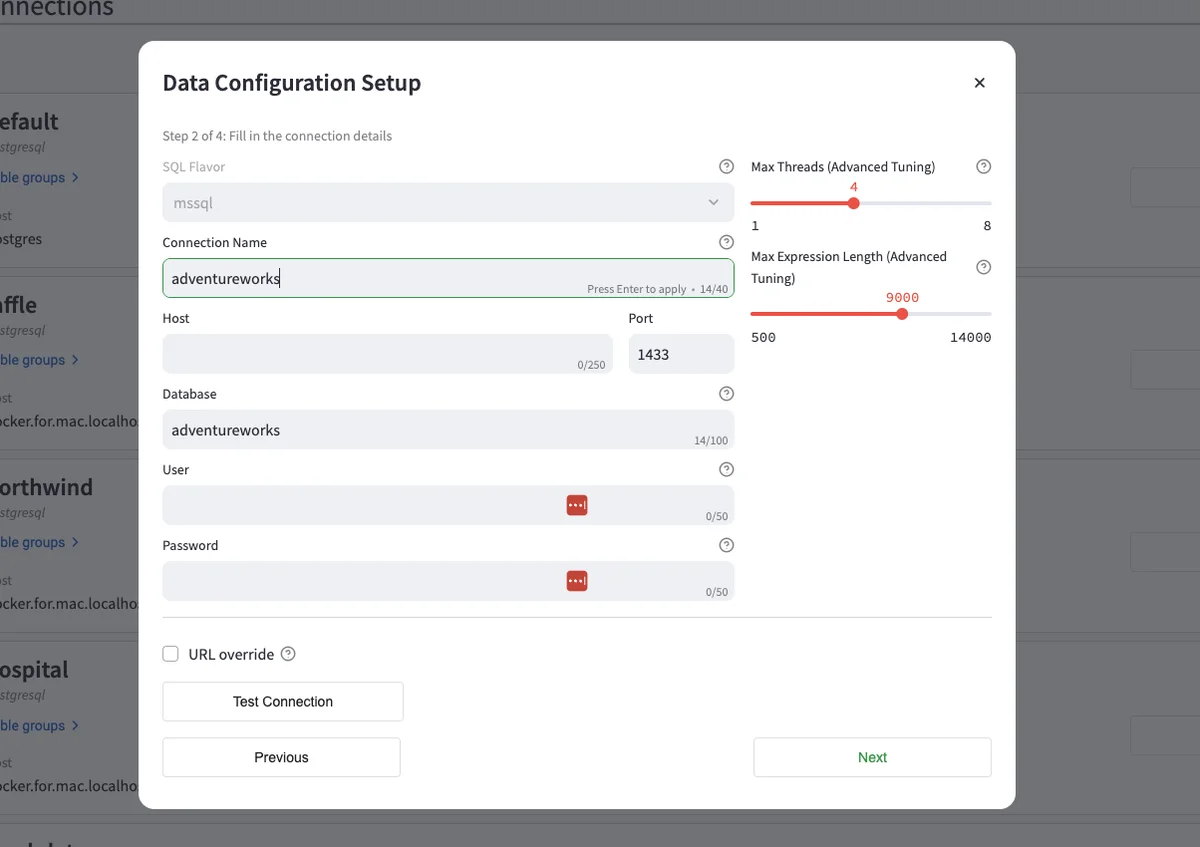
Please name the connection, host, database, and user/password. Hit 'Test Connection' and see a green dialog box that says, 'The connection was successful.' Once that is done, hit 'Next,' and you will be taken to a dialog to create a Table Group.' A table group defines the tables you will use for this use case. Here is an example of the configuration:
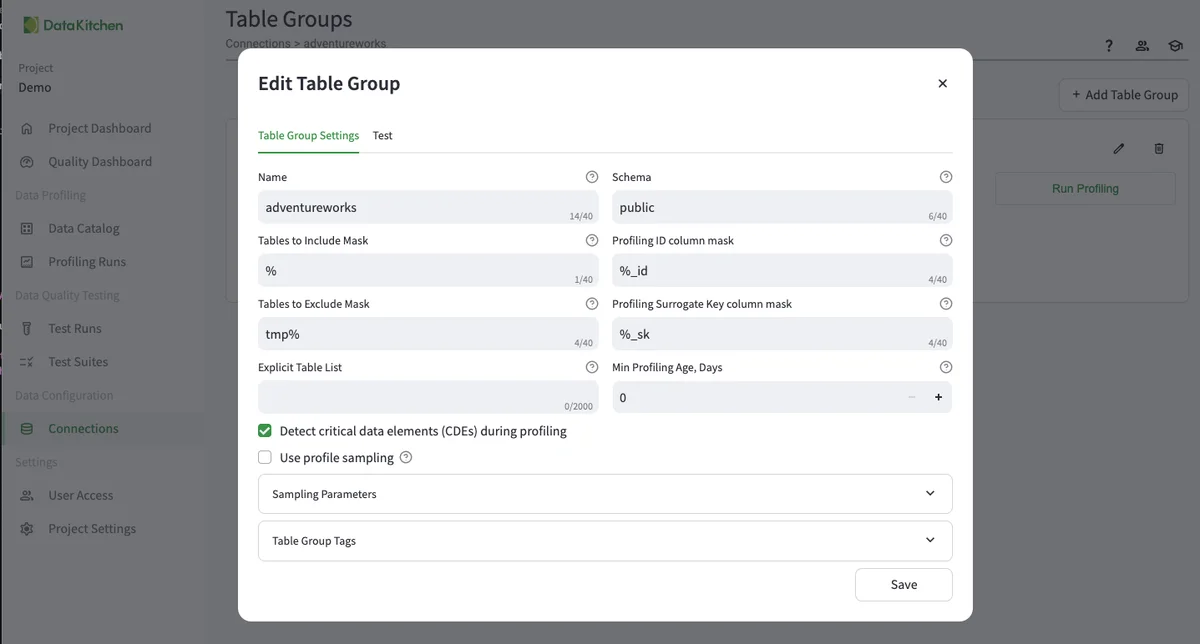
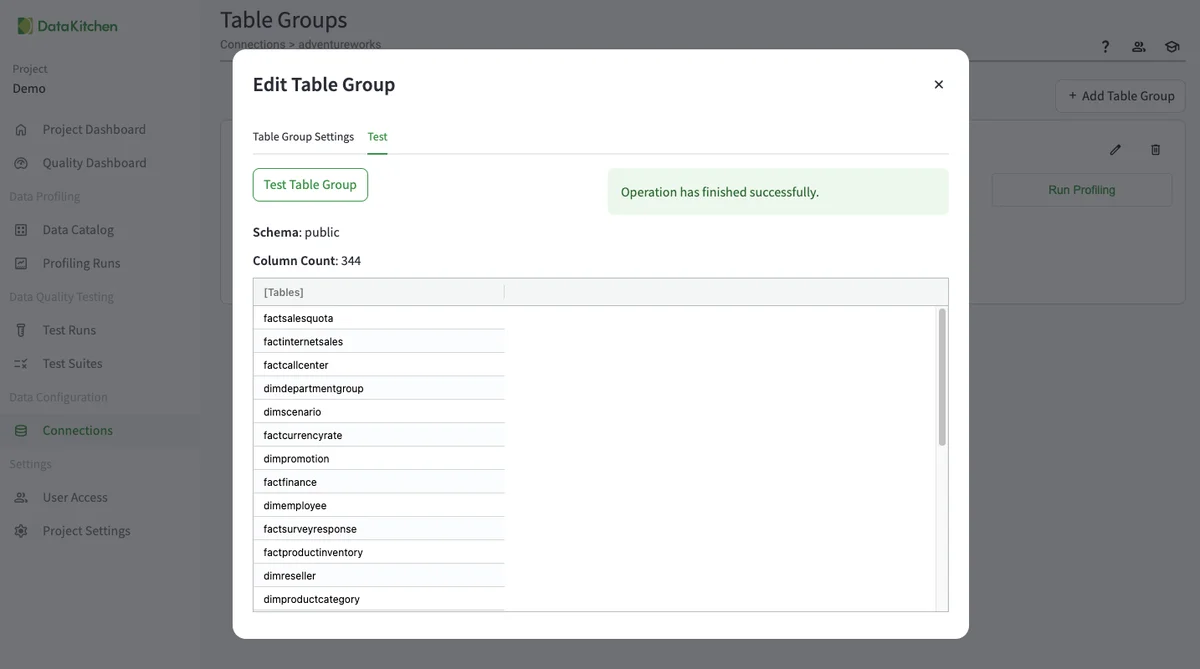
Hit the 'Test' tab to see the list of available tables. That way, you can make sure the Table Group is configured correctly. Don't forget this step!
Run Profiling
In the next step, you will be asked to run data profiling after setting up your Table Group. You will see a dialog box that looks like this.
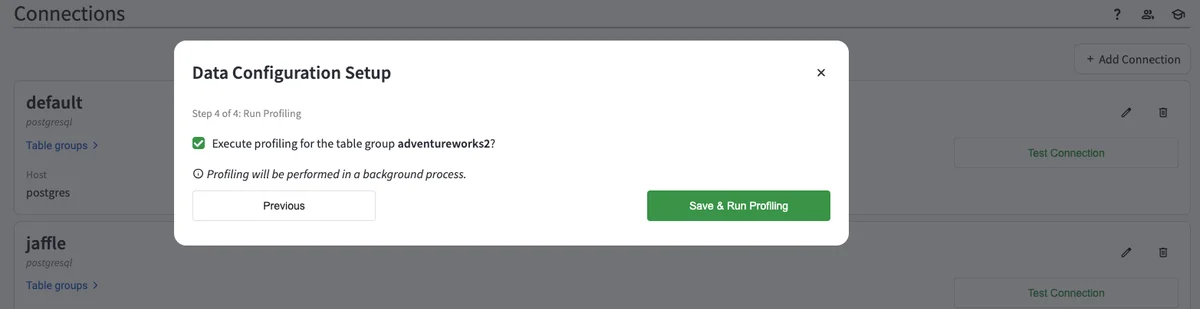
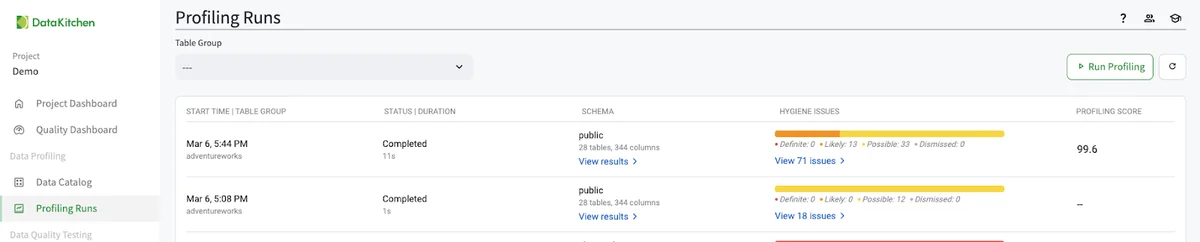
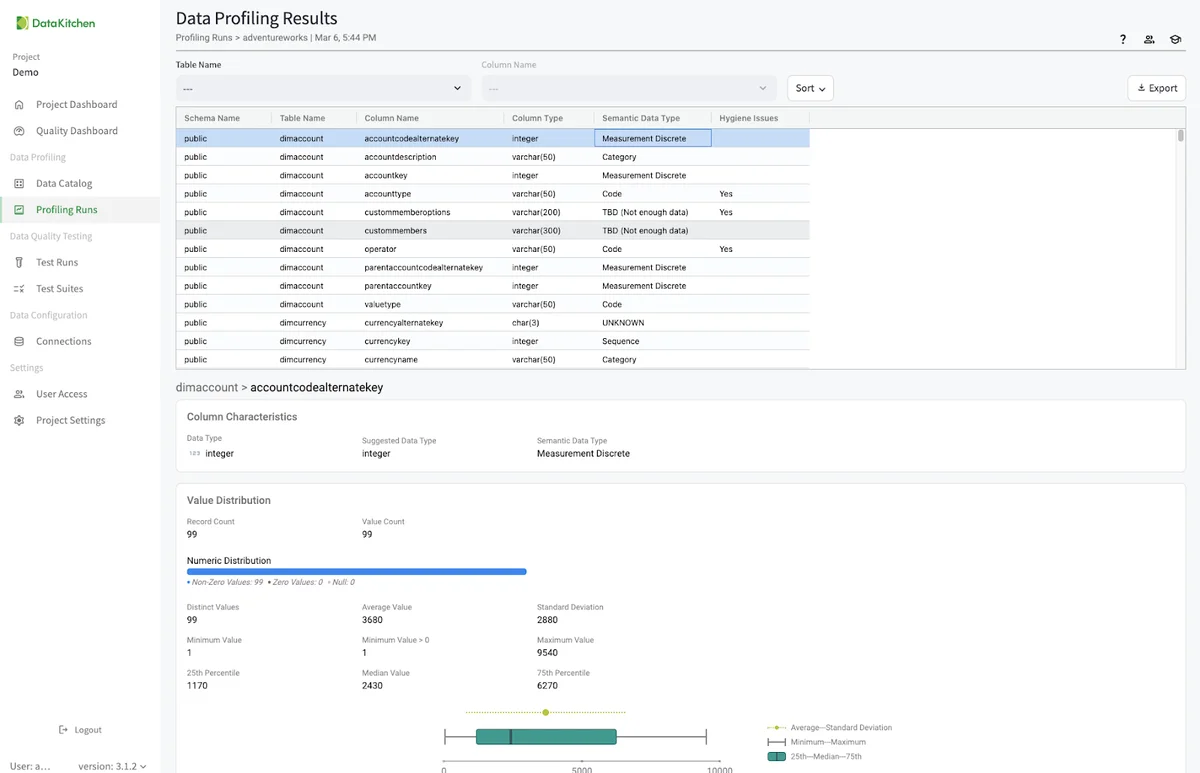
You can also run data profiling from the 'Profling Runs' list page by hitting the 'Run Profiling' button in the top right. You will then see a list of the profiling runs in the UI. Data profiling has 51 different characteristics that it collects about the data. You drill into them by hitting the 'View Results' link.
This will take you to a page to view every data profiling result for every table in your Table Group.
Examine Data Hygiene Issues
Returning to the 'Profling Runs' list page, we want to look at each data hygiene issue. These are automatically created from the data profiling database. There are over 28 individual suggestions for improving your data quality. You can use these to patch your data, push back on your data providers, or just let them pass. You can also disposition each issue to either acknowledge it as a problem, turn it off in the future, or dismiss the issue entirely. In the AdventureWorks data, you should see over seventy individual hygiene issues.
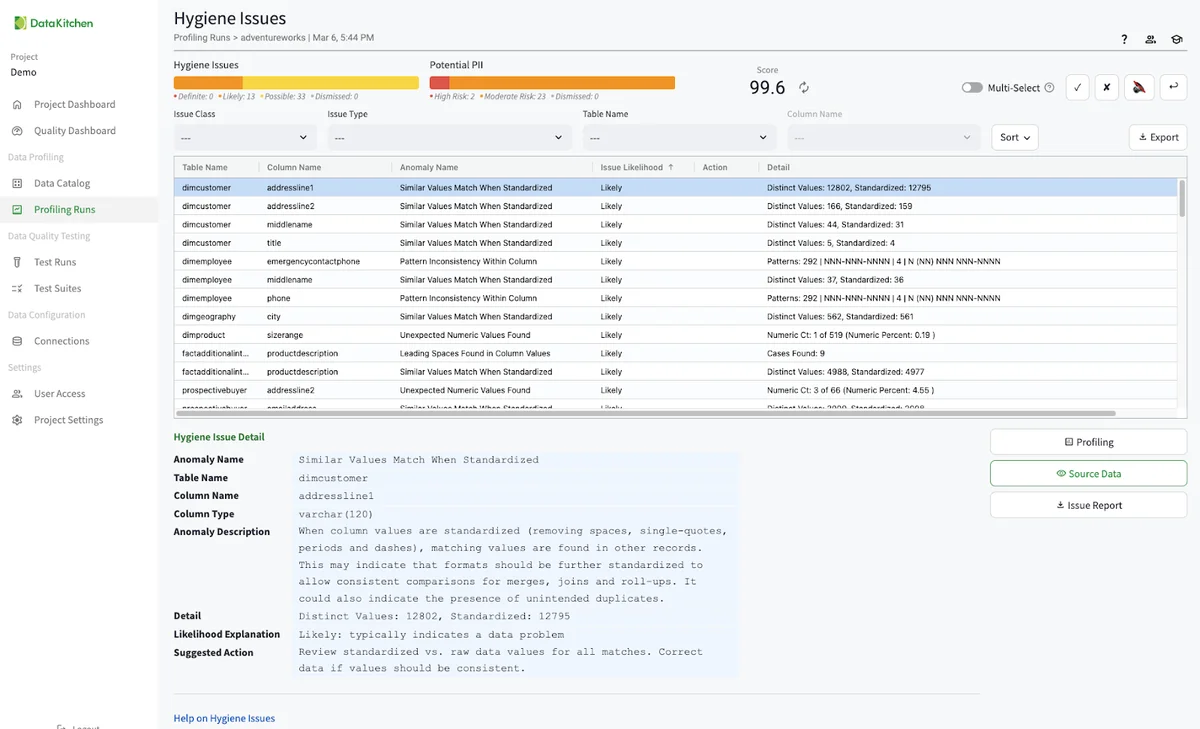
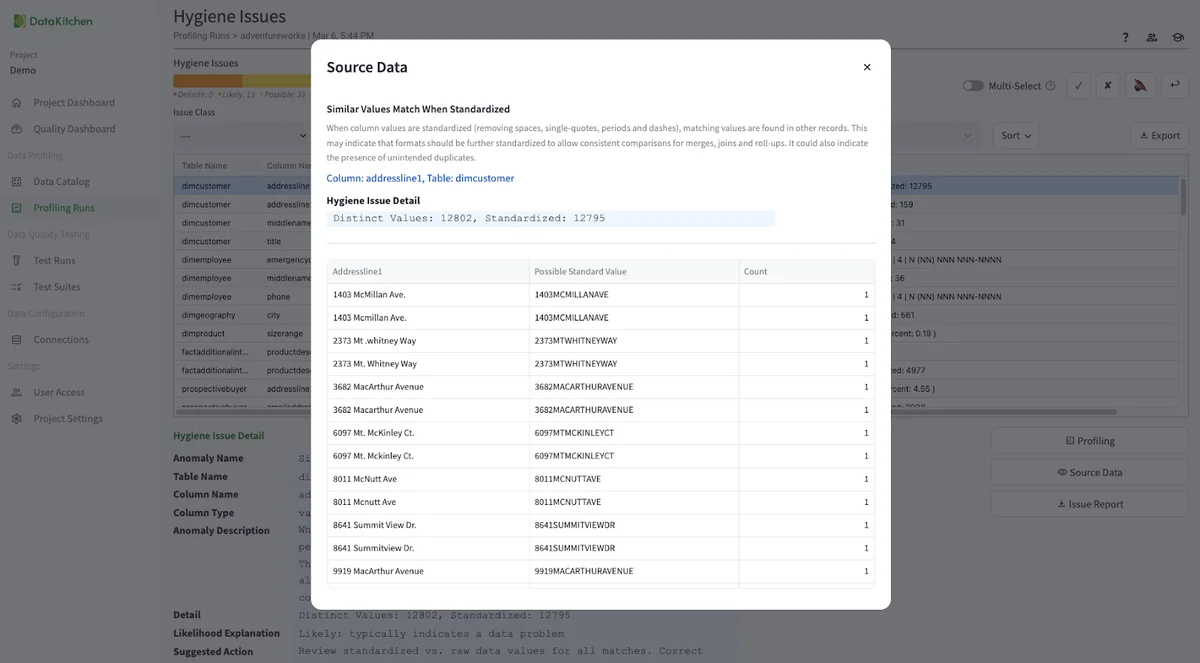
You can click the source data to get a sample and learn more about any issue. Here, for example, we can see address data that is close but not exact.
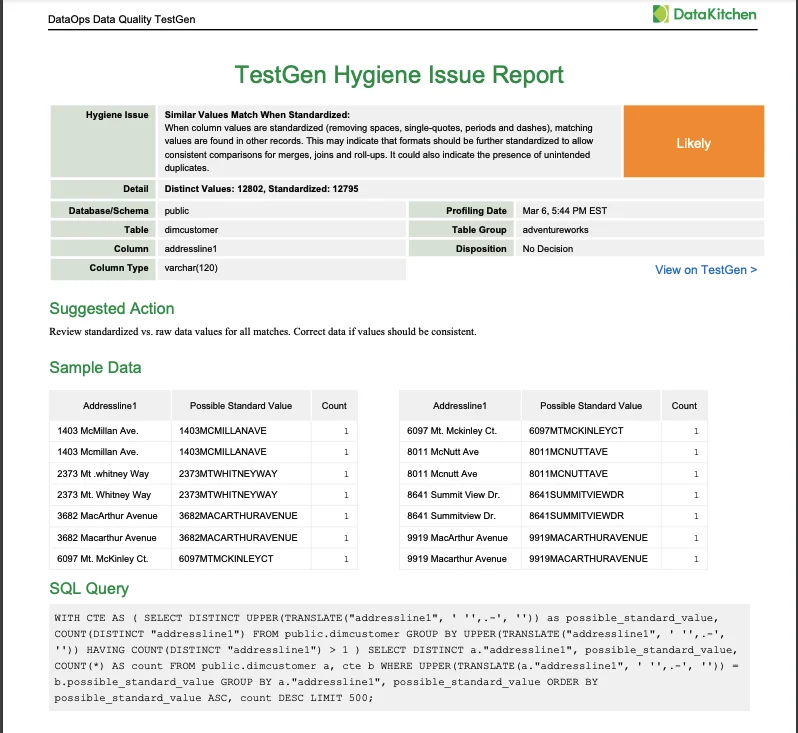
You can also get a PDF issue report to share with your team.
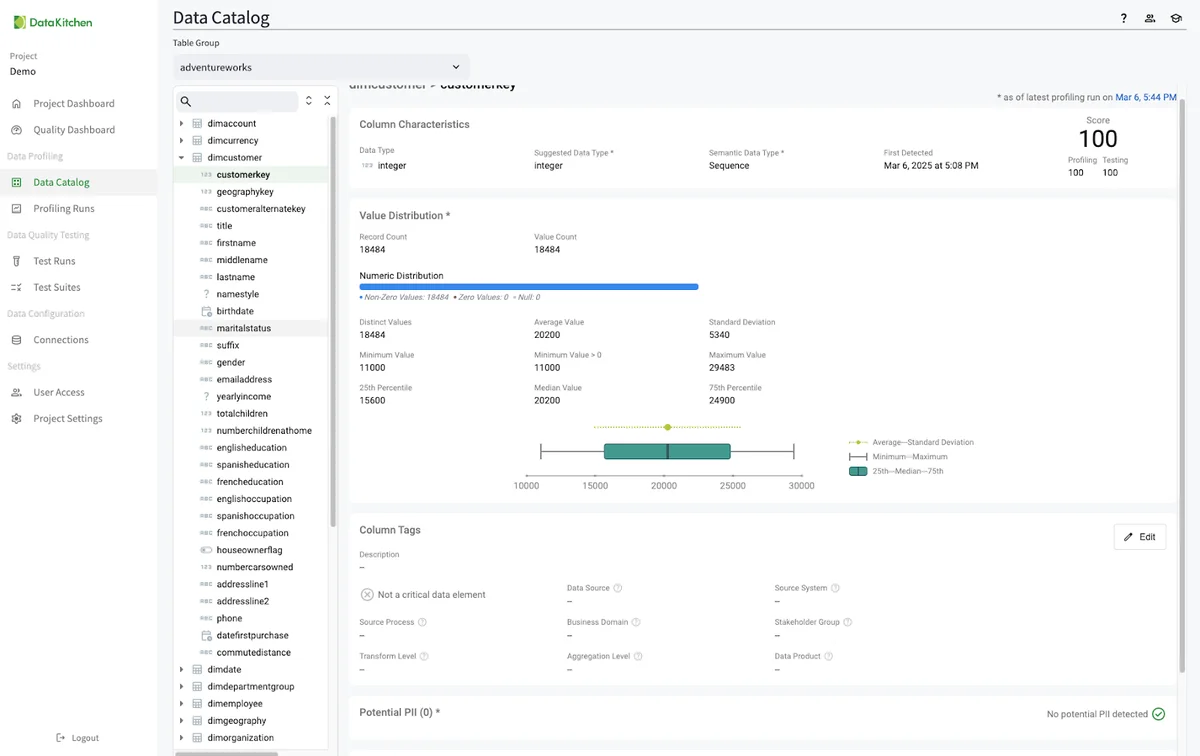
Dive Into The Data Catalog
TestGen automatically populates a data catalog for every profiled Table Group. The catalog page shows the profiling information, hygiene issues, and data test results for every table and column in your Table Group. You can edit table and column tag metadata as well.
Do Data Quality Testing
DataOps Data Quality is a generative data quality testing tool. Point it at any dataset, and it will learn from your data, screen for typical data hygiene issues, and then automatically generate and perform robust tests. This section shows you the step-by-step process to generate data quality tests automatically. TestGen supports 42 test types: thirty-two simple, fast, automatically generated data quality checks, two custom tests, and eight best practice data validation tests configured with fill-in-the-blank simplicity.
Create a Data Quality Test Suite, Generate Tests, and Run Tests
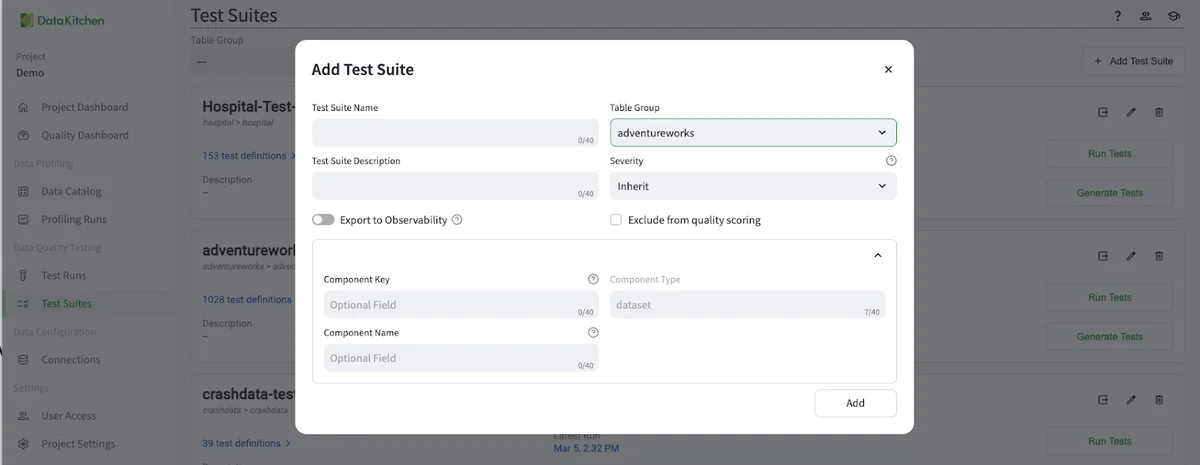
The next step is to create a Test Suite by navigating from the 'Test Suite' section of the UI and clicking '+ Add Test Suite' in the upper right. From there, you will need, at minimum, to name the test suite and optionally add other information.
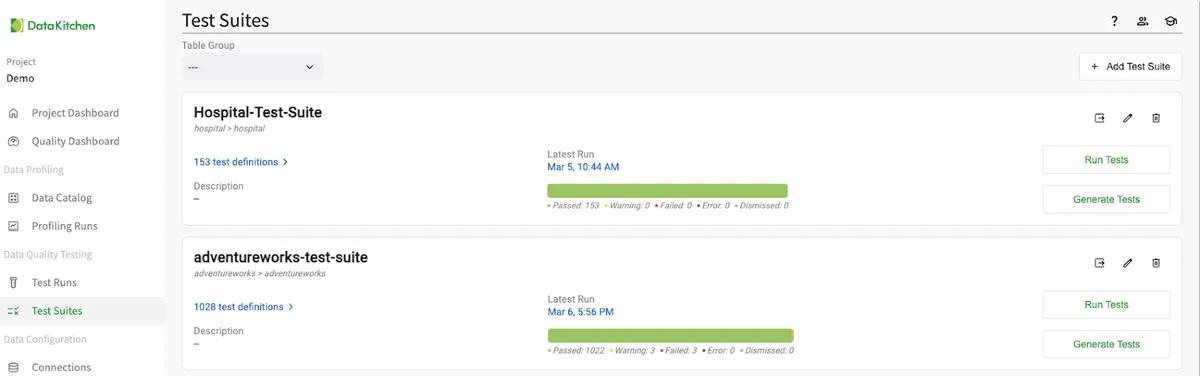
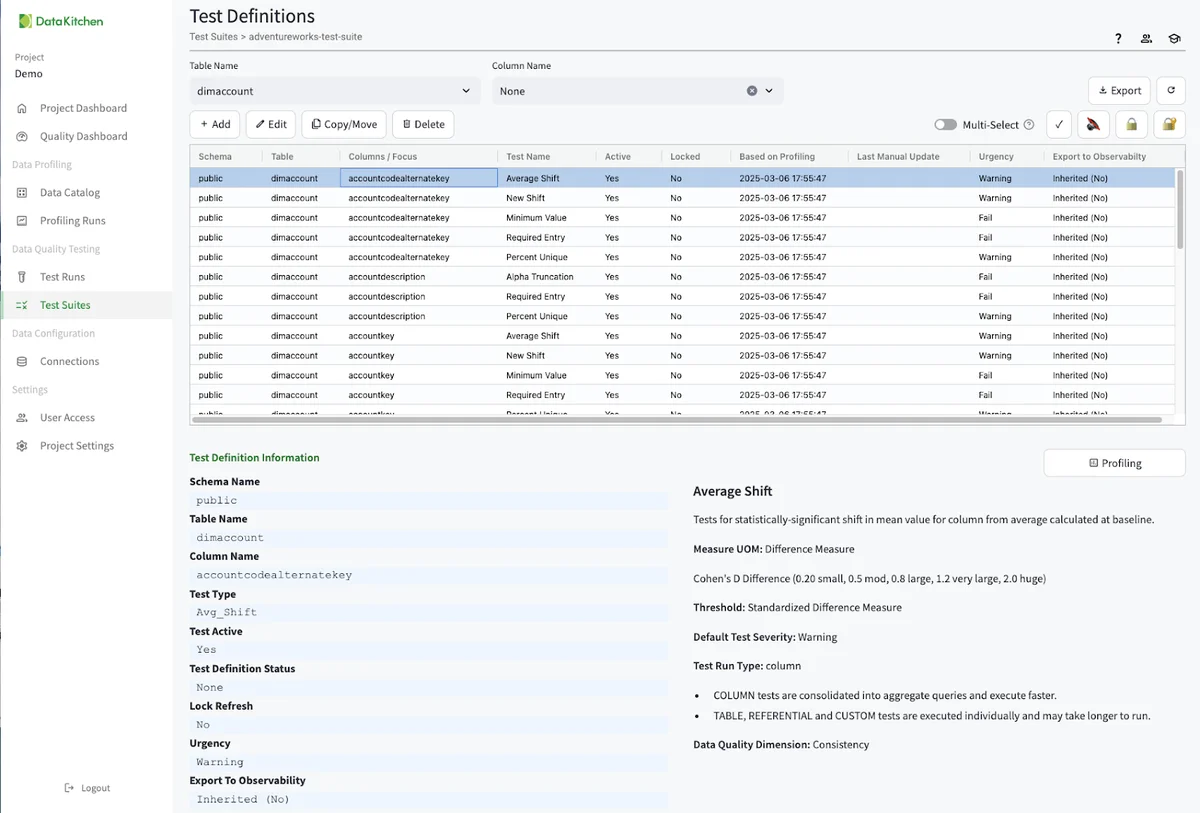
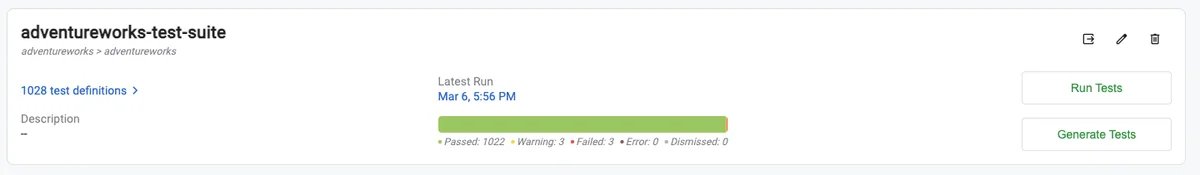
The next step is to Generate Tests by navigating from the 'Test Suit' you just created and hitting the 'Generate Tests' dialog. This will give you over 1000 tests on each column and table. To view and edit the list of tests, click on the test definitions dialog:
Finally, you need to run the tests. You can do this from the UI, the TestGen CLI, or by integrating with your scheduler or orchestrator. Below, you should click the 'Run Test' button from the AdvetureWorks Test Suite.
This will create an entry in the 'Test Runs' listing. See below
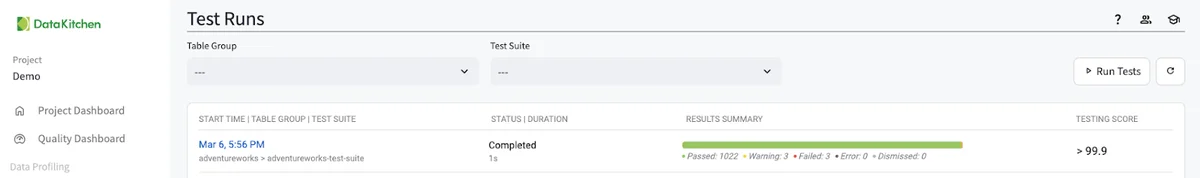
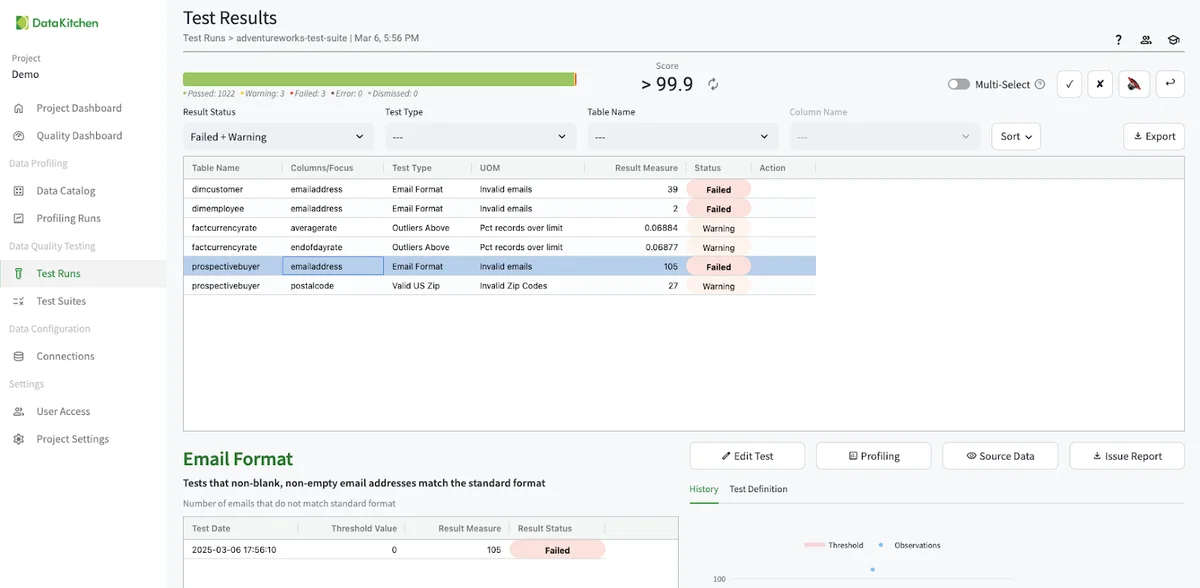
Clicking the blue time in the UI will take you to the test results UI for that test run. You will see only a few test results.
Testing Data Updates
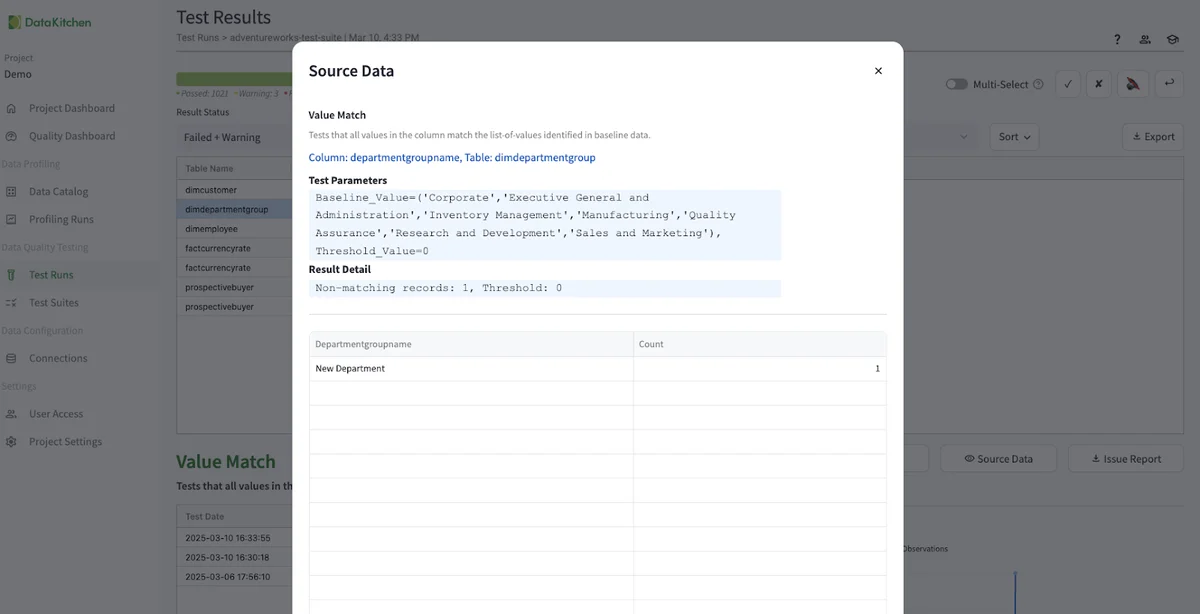
TestGen tests are designed to look for anomalous changes in the data. Since there have been no changes to the data, TestGen has only found a few issues. TestGen will find more issues as the data changes every time it runs. For example, I went into my database tool (in this case, Pycharms), and added a new row to the dimdepartmentgroup table.
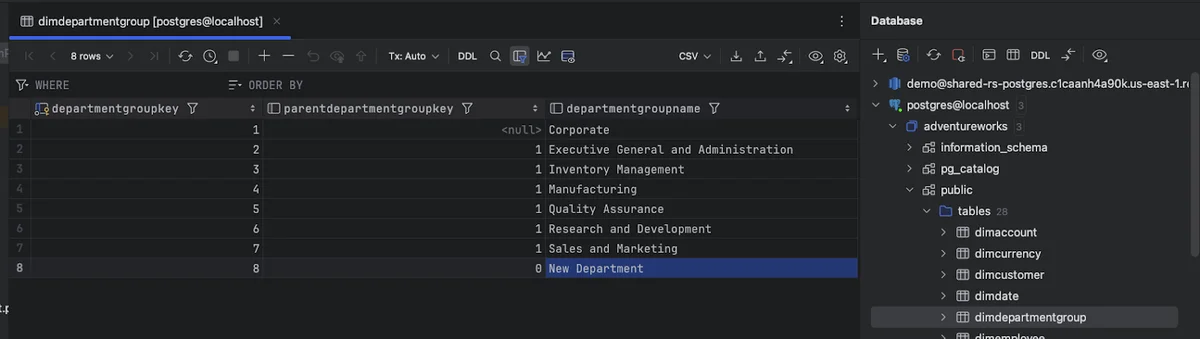
I added a new row called 'New Department' to the table. I then went to the TestGen UI and hit 'Run Tests' for the AdventureWorks Test Suite we created above. When the test run is complete, and then you got to the 'Test Runs UI, then click on the latest AdventureWorks test suite run, and see that TestGen has picked up the department group entry as an error. You can then disposition the test, edit the test manually, or re-profile the database and regenerate the test to pick up the new value.
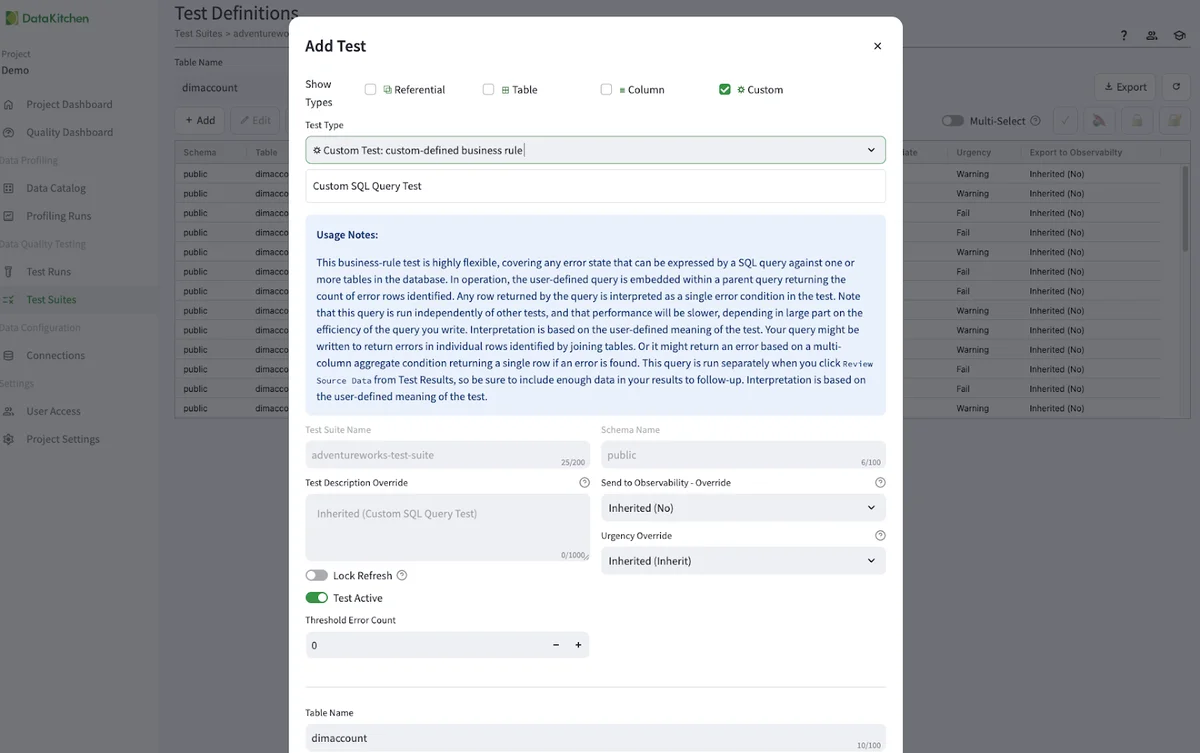
Create a Custom Test
DataKitchen thinks you can get 70-80% coverage in all the data quality tests you need through our generative test engine. However, some industry-specific tests require a level of customization that AI alone may not capture. These tests, however, should not be buried in complex code repositories. They should be shareable and visible. This approach ensures that critical domain-specific data quality checks remain scalable and manageable while allowing organizations to benefit from automation wherever possible. The remaining 20% of domain-specific custom tests should be where you focus your time. This is where you can add real value to the business instead of just being a data plumber. Below, we see an example of the UI used to create a custom test:
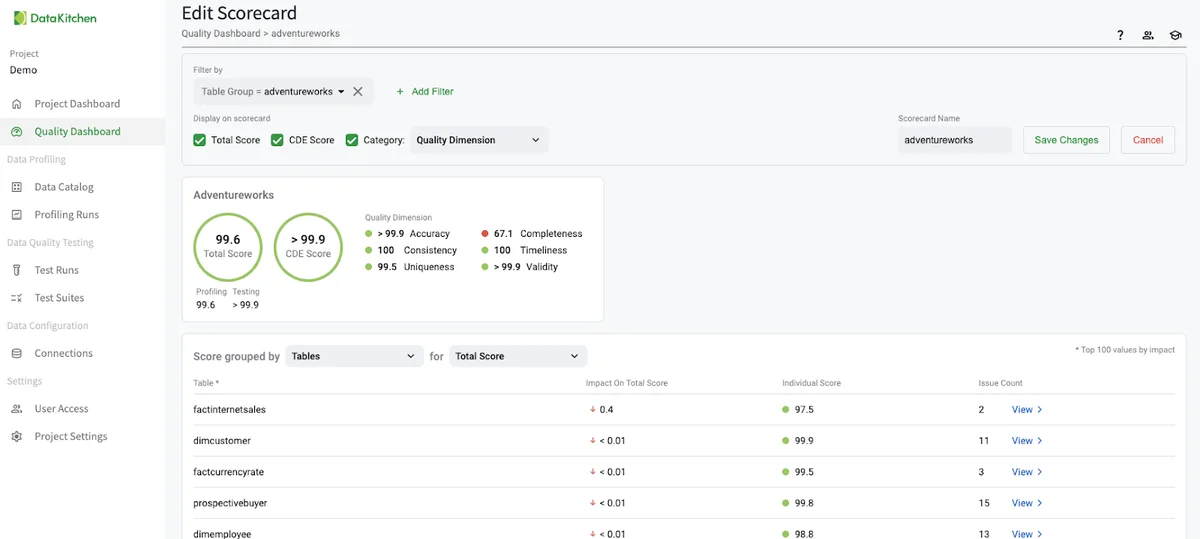
Dig Into The Data Quality Dashboard
Data quality dashboards have emerged as indispensable tools for data quality leaders, offering a clear window into the health of their data and enabling targeted actionable improvements. However, not all data-quality dashboards are created equal. Their design and focus should vary significantly depending on an organization's unique goals, challenges, and data landscape. By creating focused, specific dashboards on selected data elements, data quality organizations can maximize their influence, streamline efforts, and drive meaningful, sustained improvements in data quality.
DataOps TestGen automatically creates a data quality dashboard for every Table Group. These show up in the 'Quality Dashboard' part of the UI, as seen below:
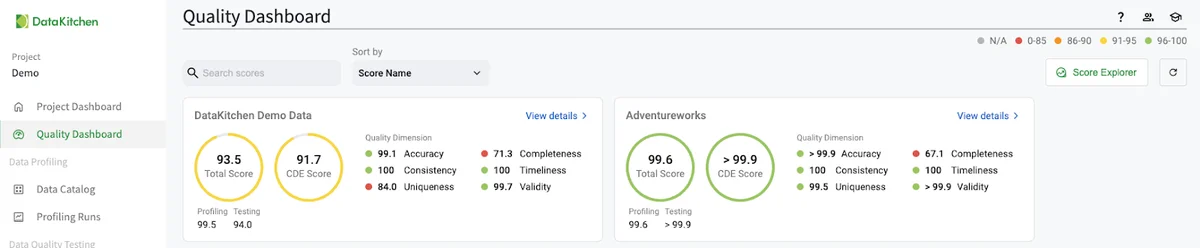
Clicking on the 'Score Explorer' in the UI allows you to create a custom data quality dashboard based on specific elements such as Critical Data Element (CDE), business goal, data source, data customer, and other metadata. With the right dashboards, your organization can move confidently toward its data-driven goals and ensure that decisions are built on a solid foundation of high-quality data. You can gain influence and success in your organization as a data quality leader!
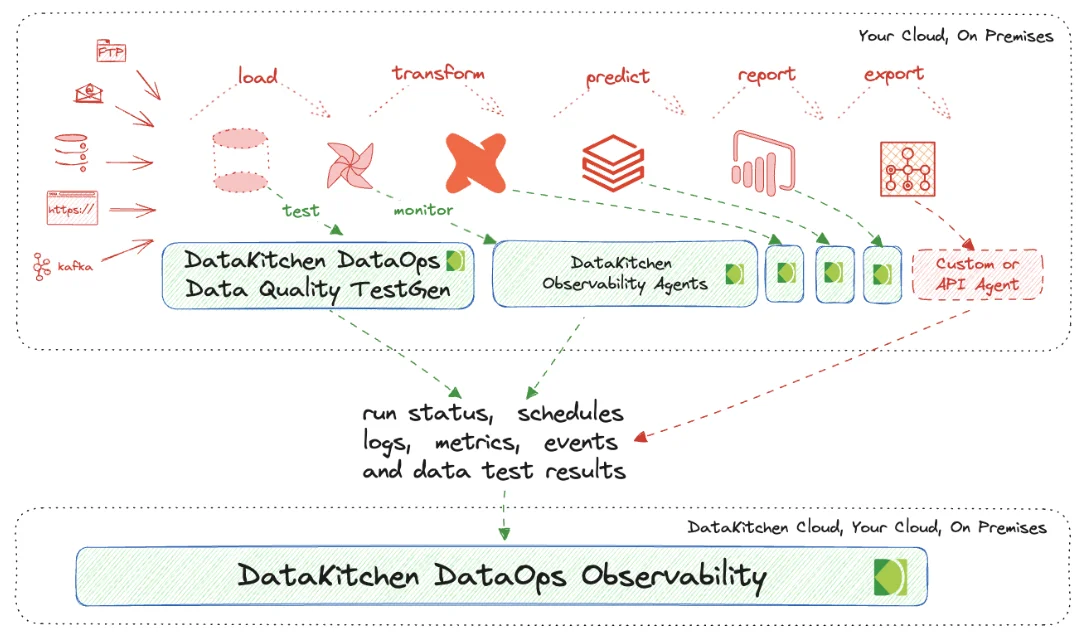
Get The Complete Picture: Connect To Open Source DataOps Observability
How can you ensure everything, not just the data, is correct for your customers? How can you monitor those tools in a Data Journey to coherently sense your production process? You have to look both at data in place and data in use. Data in Place refers to the organized structuring and storage of data within a specific storage medium, be it a database, bucket store, files, or other storage platforms. In the contemporary data landscape, data teams commonly utilize data warehouses or lakes to arrange their data into various layers. Data in Use pertains to how data is actively employed in business intelligence tools, predictive models, visualization platforms, and even during export or reverse ETL processes. These applications are where the rubber meets the road and often where customers first encounter data quality issues. Problems can manifest in various ways, such as Model Prediction Errors in machine learning applications, empty dashboards in BI tools, or log errors from the tool itself.
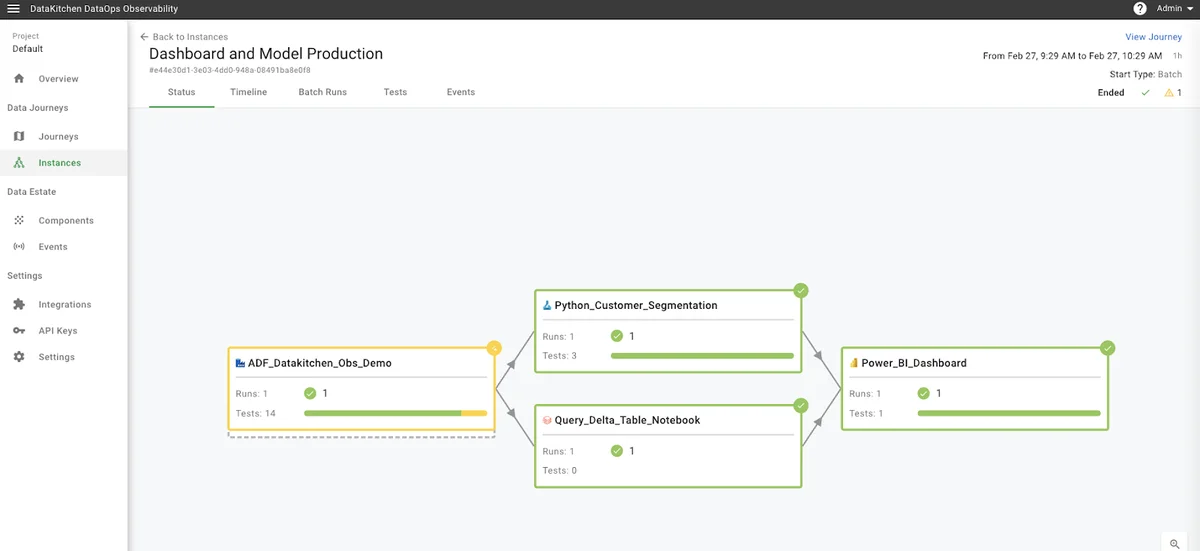
DataKitchen's DataOps TestGen Tool focuses on checking database data. Our DataOps Observability focuses on collecting data through APIs and Agents that talk to the tools you are using in your data architecture. You can find out how to connect DataOps Data Quality TestGen to Data Observability in this tutorial:
Go Further With DataOps Data Quality TestGen
Request a demo of the Enterprise version ($100 per Month per User/Connection).
Join the community on Slack.
Quality is not just about data - you need to monitor the tools that act upon the data. Install Open Source DataOps Observability.