Monitor for Errors and Trends
Track operational statistics to fine-tune workflow performance, improve cycle times, and ensure quality data and analytic output.
Ironically, a lot of analytic teams aren't very analytic about their production processes. In DataOps, you keep track of some things: What are your error rates in production? What part of the pipeline and which pipeline are they running on? Which data provider is giving you bad data? Are you meeting your SLAs? What's your coverage in the tests? These are very important metrics.
Process metrics for data engineering and data science teams help an organization understand itself and how it can improve. These critical measurements of error rates, cycle times, and productivity shed light on how people work as a team and how the data team creates value for customers.
First, you want your production pipelines to tell you if something's wrong before your customer sees it. So, test both data and code, and monitor automatically on top of production, across the entire pipeline. Send alerts and notifications and keep track of the history of this running system, because that history is actually a good source of analytics. Focusing on lowering your error rates and process efficiencies actually result in more innovation. It leads to less fear and stress and more time and inclination to experiment. If you focus on errors, you actually end up getting more value for your customers.
Second, take a longer view overtime at your projects and pipelines. There is a term from DevOps called observability. It means looking at trends in errors; looking at the number of tests you have in a pipeline; looking at delivery times. If you track these across run history and operational metrics, a kind of "process lineage," you can start to find patterns. By measuring, you provide evidence to start improving the processes and behaviors of your teams.
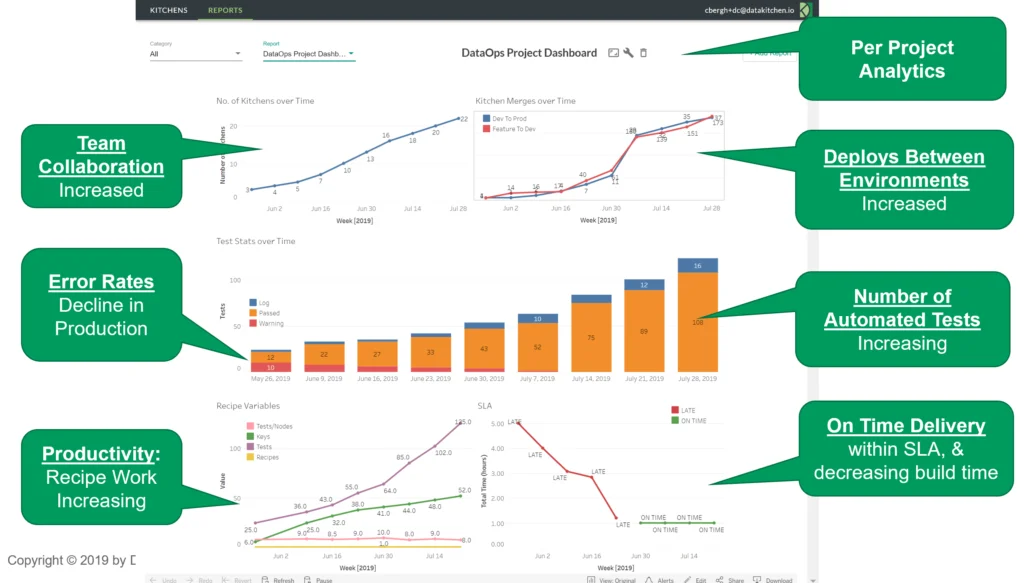
A typical dashboard of operational metrics can show trends in team collaboration, error rates, productivity, deployments, tests, and delivery time. Each of these measures sheds light on the organization's development processes.
- Team Collaboration measures teamwork through the creation of virtual workspaces. Each workspace corresponds to a new project or sub-project in a team context.
- Error rates show production warnings at a rate of 10 per week, falling to virtually zero. This reduction in errors is the positive result of the 100+ tests operating 24x7 checking data, ETL, processing results, and business logic. As the number of tests increases, the data pipeline falls under increasingly robust quality controls.
- Team productivity measurements use the number of tests and analytics created. The rise in pipeline "steps" coupled with the increase in test coverage shows a thriving development team. Also, the number of workspace merges shows the completion of projects or sub-projects. A "Feature to Dev" metric shows new analytics ready for release. "Dev to Prod" merges represent deployments to production (data operations).
- On-time Delivery measures deployment cycle time, and how well it meets the target service level agreement (SLA).
Your production pipeline or data operations is a factory and like any modern manufacturing facility needs to be tracked and managed using analytics.