Find Problems in Constantly Changing Data with Anomaly Detection
"Polling: Arrival Aberration Alerts"
Your challenge
So many variables in complex, modern data pipelines are out of your control. Data quality doesn't have to be! Most data teams face data sets that are undergoing constant change. You may have a Salesforce integration that pulls new data every five minutes. You may have many data ingestion processes running frequently in an intricate sequence. At one end, source data is changed without warning. At the other end, analytic tables get tweaked on the fly. You can't control the behavior of problematic data providers, but your team takes the blame. It's on you to watch for data freshness, volume changes, schema shifts, and data anomalies. It's on you to vouch for overall data health.
You need help to quickly identify issues in your data before someone else finds them first — before bad data is passed into reports, models, or other deliverables. You need to confirm that your data is fresh. You need to be sure that data volume is trending in the right direction. You need to know if a schema has been altered or if there is any change to the health of your data. You want to get alerted without being bothered with every transient issue. The sooner you find problems with your data, the better!
Tutorial goal and methods
This tutorial aims to help you understand how to check data for anomalies periodically. We will use DataOps TestGen and DataOps Observability for this tutorial. Please read this blog post for more background on this use case.
Background
The best place to find problems in your data or analytics is before your customers see the resulting error. You can do that in three places.
- When you first get the data
- When it's been updated
- When it's used in production with other data and tools.
In Part 1 of this tutorial, we discussed using TestGen to help understand and locate problems in your source data. In this section, we help you find problems with data before it gets to production. You may have just ingested data, have a CDC process, or have a frequent process that pulls data from an ERP system. Can you quickly learn if there is a problem/anomaly issue without too much noise? In Part 3, we will look at checking data in production with all the other tools that use the data.
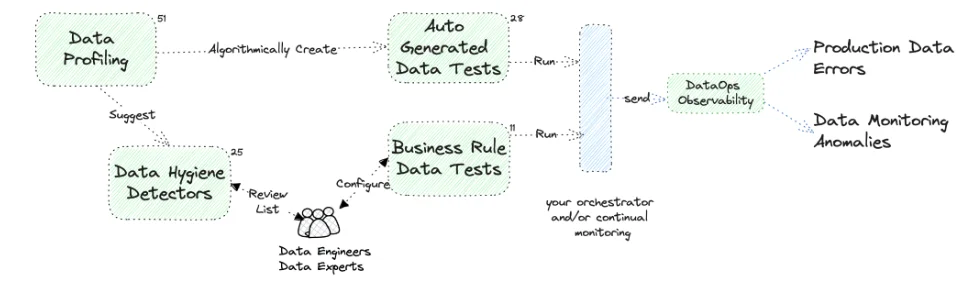
The image describes the synergy between DataOps TestGen and DataOps Observability. The diagram separates the creation and running of tests (the left part) from the action upon the data through observability (the right part of the diagram), showing that testing and monitoring are separate but integral parts of the DataOps process. The left side process is cyclical, with data hygiene detectors and auto-generated tests looping back into data profiling, showing a continuous loop of improvement and validation to maintain the data quality over time. The diagram also shows an interplay between automatically created and manual business rule tests, crucial for maintaining data integrity.
Step-by-step guide
Setup
You should have gone through all the DataOps Observability and DataOps TestGen installation and demo setup steps.
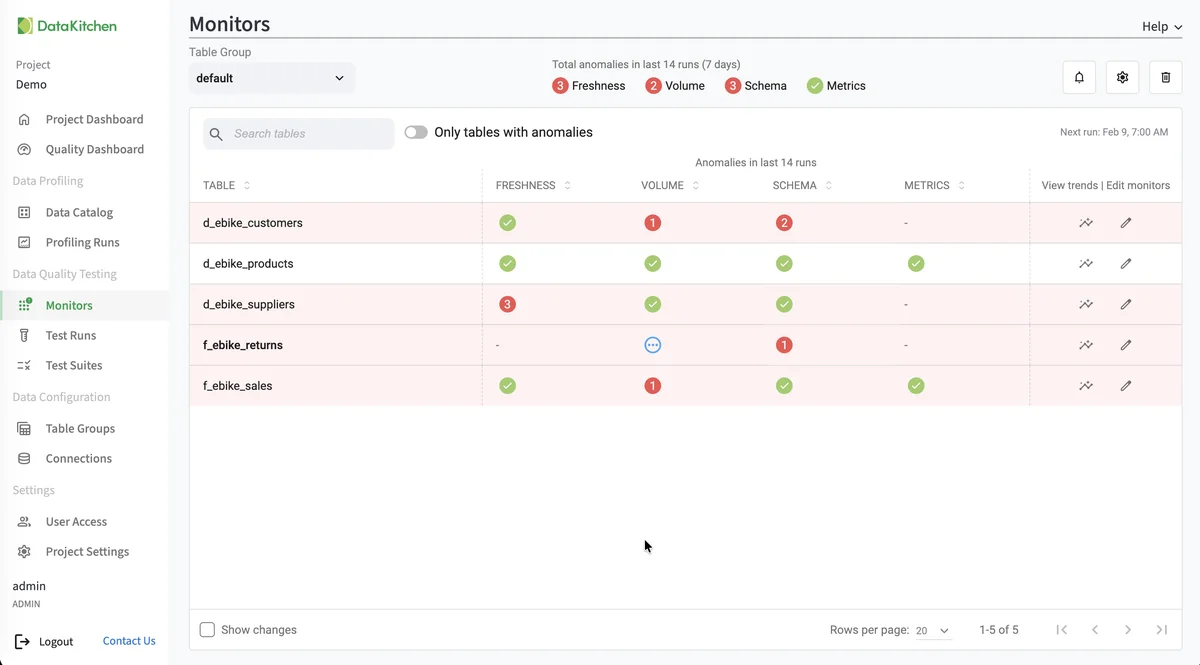
Monitors
Monitors provide proactive anomaly detection for your data tables. While tests check your data against specific thresholds, monitors learn your data's patterns over time and alert you when values deviate from what's expected.
TestGen supports four types of monitors:
- Freshness – Detects when tables are not updated on their expected schedule
- Volume – Tracks row count changes and alerts on unexpected spikes or drops
- Schema – Detects column additions, deletions, or type changes
- Metric – Tracks user-defined metrics for anomalies
Monitors use prediction models to automatically calculate expected ranges based on historical data. As they collect more data, their thresholds become increasingly accurate.
See Monitor Tables for details on setting up and managing monitors.
You can follow all the steps in this tutorial for your data. Follow these steps: add a connection to TestGen, create a Table Group, perform profiling, then generate tests, and finally run tests manually.