Understand and Check Data Pre-Production
"Patch Or Pushback Data"
Your challenge
As a data engineer or data quality professional, you have faced this challenge: you have some new data that you need to work with for analysis. A brand new dataset or table has changed recently. To work with the data, you need help understanding the data itself. However, you also need some suggestions on the health of each column. Do you have to patch the data itself before you can use it? Do you have to push back on the data provider to improve the raw data? Or can you immediately incorporate the new data into your data and analytic processing?
Tutorial goal and methods
This tutorial aims to help you understand and profile your data and identify potential data health issues. We will only use DataOps TestGen for this tutorial. Please read this blog post for more background on this use case.
Background
Data profiling is the periodic investigation of tables in a schema. During a profiling run, TestGen will scan every table in a column (scoped to a table group) to gather information about the data types, column contents, and patterns.
Profiling a table group creates Profile Results. Those results are available for inspection in the TestGen UI and for export via the testgen get-profile CLI command. TestGen analyzes 51 different column characteristics of your data while profiling. In addition to profiling the data, TestGen marks specific results as health anomalies — 25 specific inconsistencies or potential issues in the data content, structure, and assumptions of your data and it flags them into three categories of actionable priority: Definite, Likely, or Possible.
Step-by-step guide
Setup
You should have gone through all the DataOps Observability and DataOps TestGen installation and demo setup steps.
As a background, the demo for DataOps TestGen contains a database with four tables: d_bike_customers, d_bike_products, d_ebike_suppliers, and f_ebike_sales. The tables with d_ are dimension tables that contain data about customers and products, and the f_ table is a fact table that contains transactions from customers for bikes sourced from suppliers. This data is loaded in a Postgres database as part of the run-demo command you ran during setup: python3 dk-installer.py tg run-demo
Profiling runs
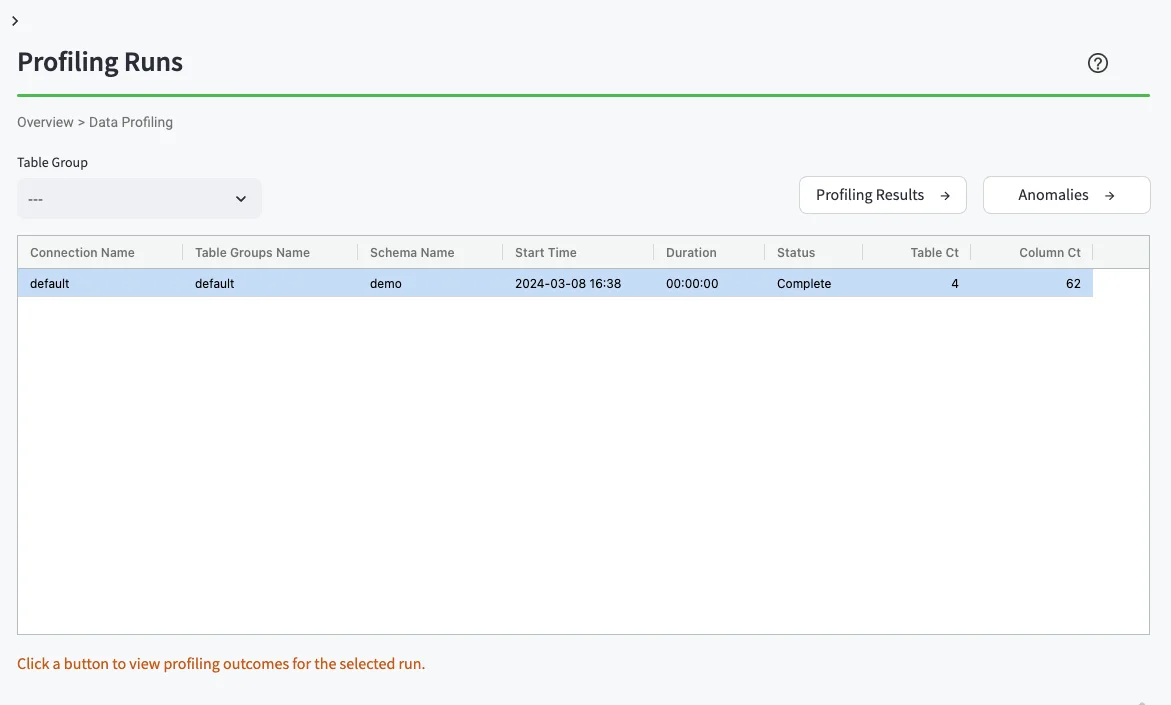
Data profiling is the periodic x-ray of tables in a schema to gather extensive information about the contents of each column. Results are stored in a standard table in DataOps TestGen. The first stop is the list of profiling runs. Each profiling run is for a specific table group used for a specific database connection. TestGen executes the profiling by running a series of SQL statements against each column for each table in the table group. This is intended to run infrequently, weekly, or every few days. The profiling step also allows you to perform profiling on a random percentage of records within a table. However, we recommend analyzing the entire table where possible, even if the process takes some time, to capture the most complete picture of the data.
How to:
- Log in to DataOps TestGen (note: the URL and credentials are printed at the end of the installation)
- On the left navigation bar, click 'Data Profiling.'
- You should see the Profiling Runs UI (below)
Profiling results table
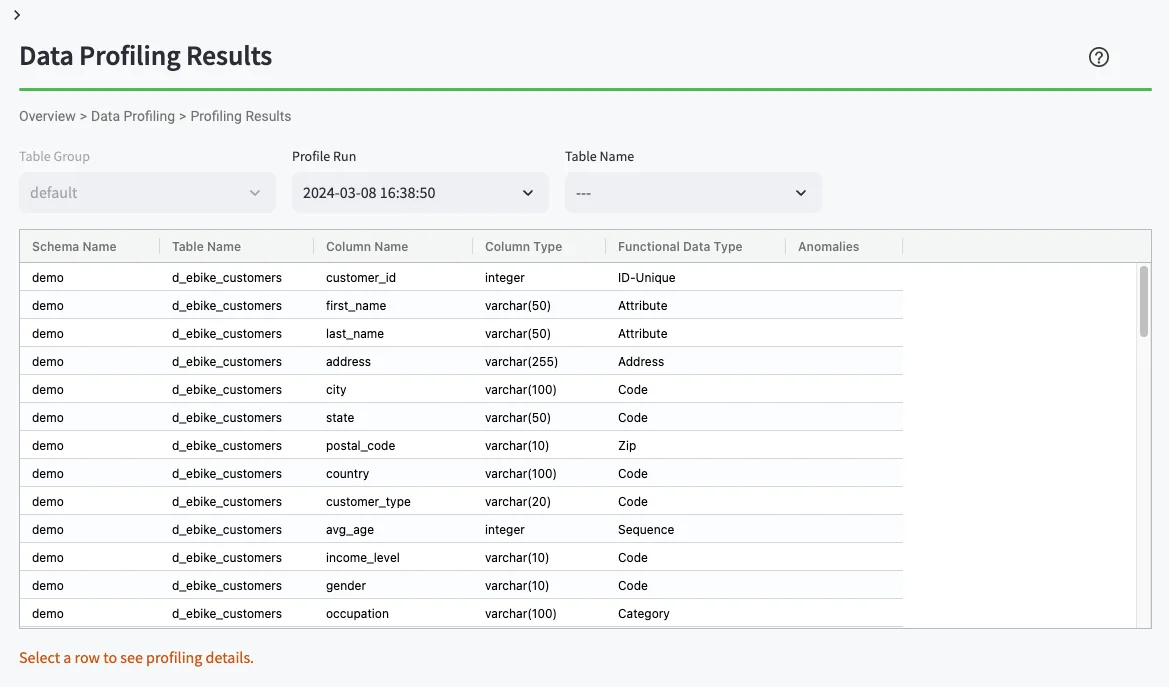
The profiling results table contains specific results for a profile run listed by schema, table name, and column name.
How to:
- Select the single row displayed in the screen above, with the results from the demo schema.
- From the 'Data Profiling' page, click the 'Profiling Results' button on the right.
- You should see the Data Profiling Results UI (below)
Single column profile details
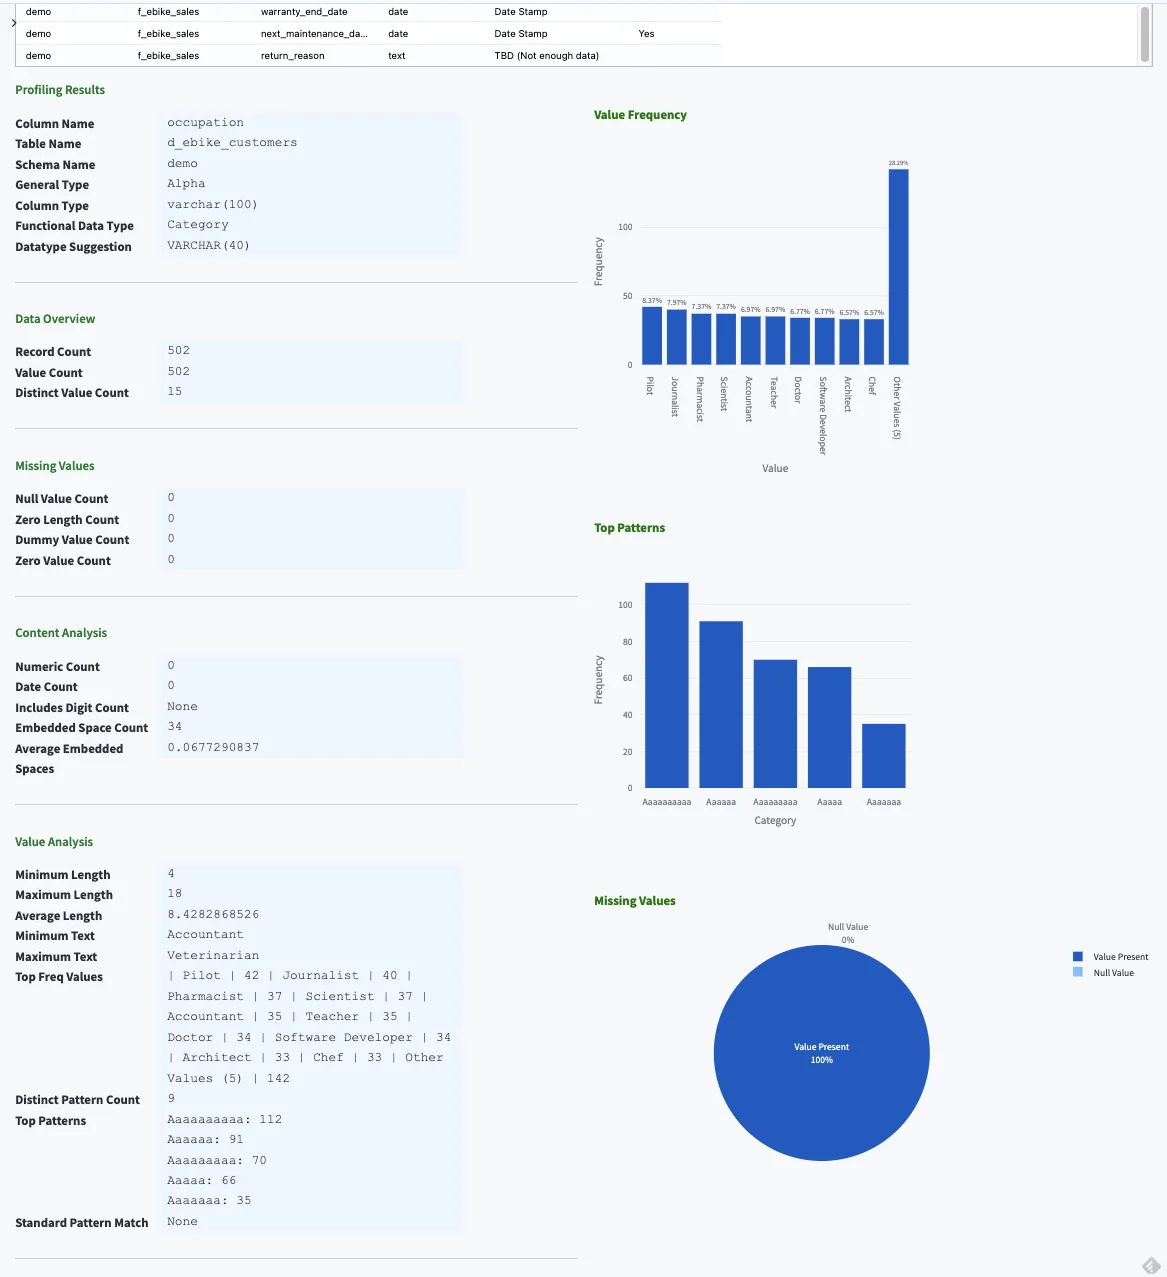
Data profiling offers a range of critical benefits, such as improving data quality, resolving data issues, ensuring compliance, and mitigating risk. Profiling your data gives you a sense of its quality — the data's accuracy, consistency, completeness, and reliability. Knowing this is critical in a financial context where data quality can impact business decisions, compliance, and customer service. Selecting a row in the Profiling Results Table gives you a detailed insight into a specific column's profile.
How to:
- From the 'Data Profiling Results' page, click a specific row.
- Scroll down on the page and you should see the Data Profiling Detail UI.
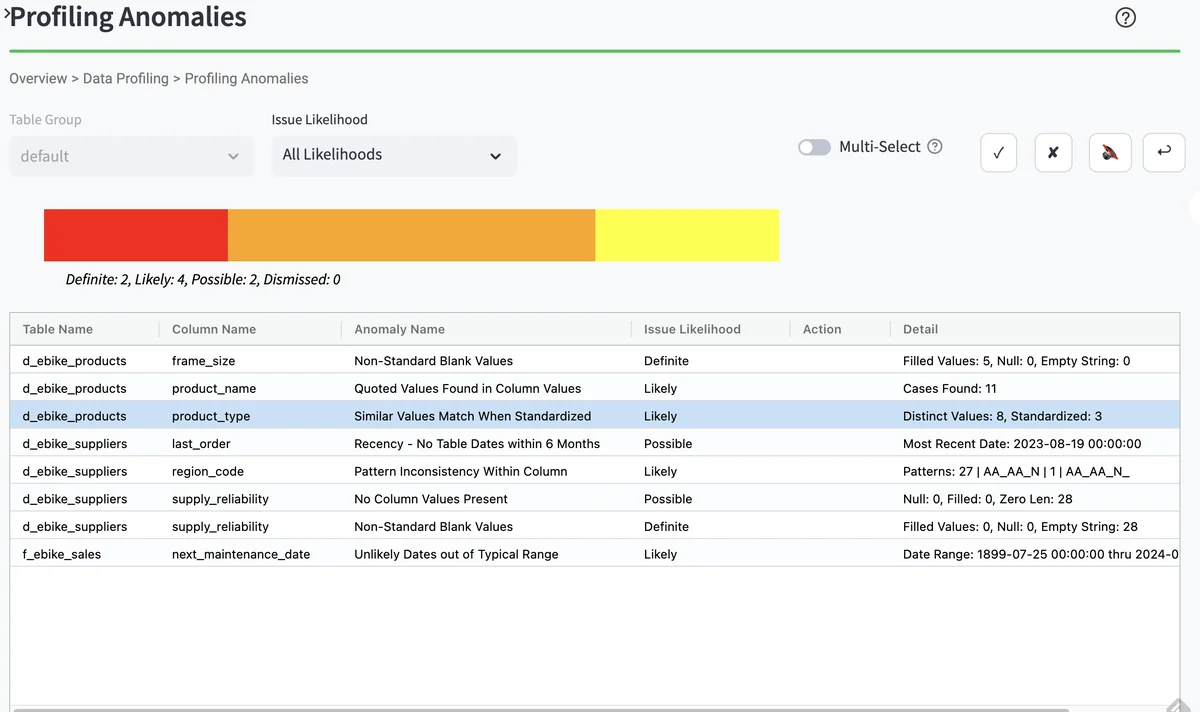
Profile health anomalies
From the Profiling runs page, you can drill down into a list of profiling health anomalies. The displayed table includes the table name, column name, and data health anomaly type. The checkboxes on the upper right allow you to view each profiling health anomaly.
How to:
- On the left navigation bar, click 'Data Profiling.'
- This should bring up the Profiling Runs UI again (below)
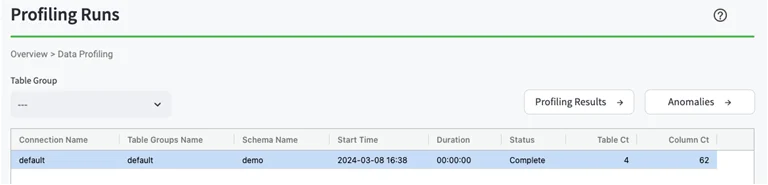
- From the 'Data Profiling' page:
- Click the single profiling runs row
- Click the 'Anomalies' button on the right
- This should bring up a list of Profiling Anomalies
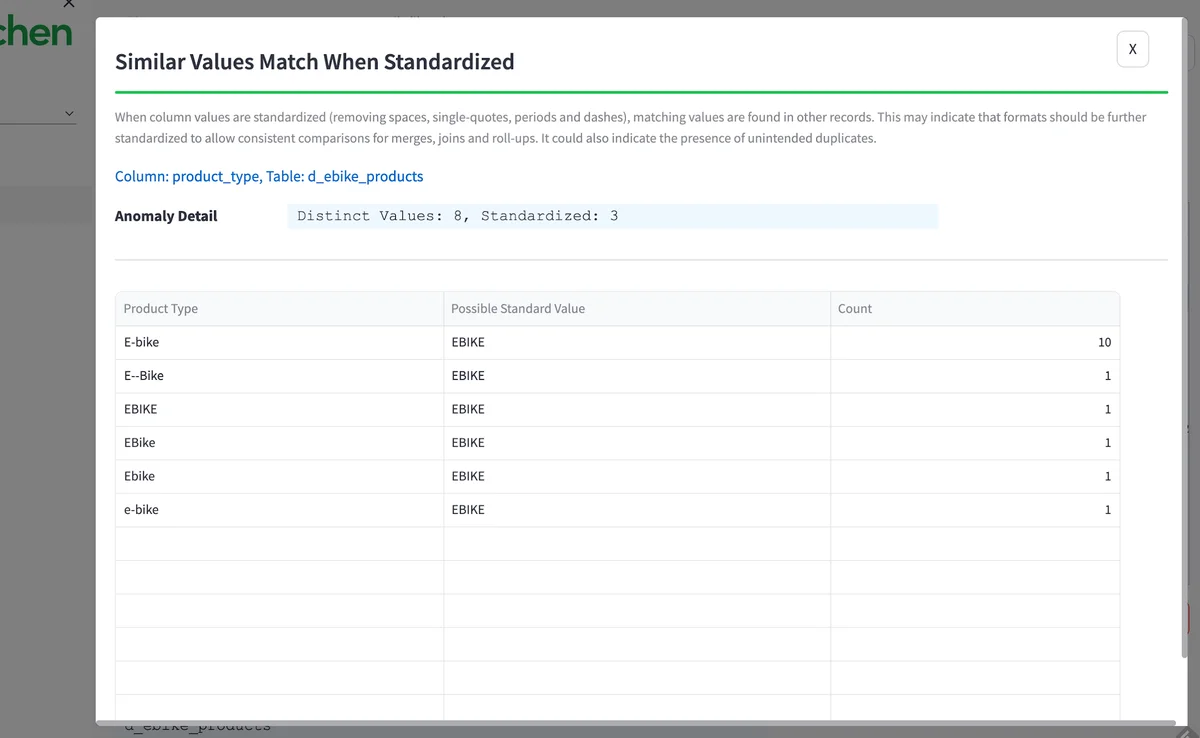
Profile health drill down
You can look at the data from a specific health anomaly by clicking 'review source data.' You can see all the various ways in the raw data that the term 'e-bike' is used in the data set. Standardizing these terms is essential for accurate analysis. Finding and fixing this is one of the many unsung heroics done by data teams to make insight accurate and valuable for their organization.
How to:
- From the 'Profiling Anomalies' page, click the row which has table
d_ebike_productsand columnprodcut_type. - You can read about this type of anomaly.
- Then click the button 'Review Source Data' on the lower right.
- This should bring up the details of the Profiling health anomaly (below).
Benefits
When you get a new data set, you face this challenge. Do I need to patch it? Or should I push back on the data suppliers to fix the data at the source? And exactly what problems in the data need to be fixed? If you don't find these problems on the first check, they will show up in your customer's data, take more time to fix, and lose trust in your work. 'Bad Data' problems fixed at the beginning are 10x cheaper than the same problem found in production. DataOps TestGen's 51 data profiling characteristics and 25 checks to screen new datasets drive this savings.
Next steps: How can I do this on my data right now?
You can do all the steps in this tutorial on your own data. Follow these three steps: add a connection to TestGen, create a Table Group, and perform profiling.