Locate Problems During Production Before Your Customers
"Production: Check Down and Across"
Your challenge
Imagine being at the helm of a data team in a bustling industry giant. Still, there's a conceptual hole in how your organization—and the industry—thinks about data analytic systems. You've helped put complex multi-step data processes into production. Still, there's this crossing of fingers, a collective holding of breath, hoping your data's steps from source to customer value unfurl without a hitch.
Despite your team's tireless efforts, your customers often encounter issues with the data and dashboards. Suddenly, your team is thrust into the spotlight—not for accolades but for blame for problems that weren't your making. You find yourself grappling with the data trapped in these complex processes that often stumble, producing insights that are met with skepticism.
You wake up each morning dreading that today might be the day something slips through the cracks. You dread that your phone will buzz with an urgent message from the CEO about a compliance report that's come up empty, igniting a frenzy where your best 26 team members abandon their daily tasks for a wild goose chase. After hours of sifting through data, the culprit is a single overlooked blank field that wreaked havoc downstream—a simple error that costs a day's work and much of the team's morale.
The concept of a 'Data Journey' has started to reshape how you and your team approach data analytics. Like a customer's journey through a service or product experience, the Data Journey illuminates the path of your data, providing a detailed view of how, when, where, and what data flows through your systems.
This Data Journey is not just a tracking tool—it's about comprehending all levels of the data estate, from the raw data to the tools, code, and tests that shape it into actionable insights across all critical dimensions. This new mindset is poised to revolutionize how you confront the challenging task of swiftly identifying issues not just in 'data in place' but also in 'data in use' and down the stack. With this approach, the morning dread dissipates, replaced by a newfound optimism in navigating the intricate data ecosystem of today's world. It's about checking across and down your data architecture and the one place where you can say what 'should be.'
Tutorial goal and methods
This tutorial aims to help you understand how to Monitor your multi-tool Data Journey With Active Data Lineage. We will use DataOps Observability and DataOps TestGen for this tutorial. Please read this blog post for more background on this use case.
Background
The best place to find problems in your data or analytics is before your customers see the resulting error. You can do that in three places:
- When you first get the data
- When it's been updated
- When it's used in production with other data and data analytic tools.
In Part 1 of this tutorial, we discussed using TestGen to help understand and locate problems in your source data. In Part 2, we helped you find problems with data before it gets to production. In Part 3, we will look at checking data in production with all the other tools that use the data.
Check out the following articles to understand why we think the Data Journey is so important and why it needs to be part of your data architecture.
- What is a Data Journey – Ideas and Background
- Data Journey Manifesto and Why the Data Journey Manifesto?
- Five Pillars of Data Journeys
- Data Journey First DataOps
Step-by-step guide
Setup
You should have gone through all the DataOps Observability and DataOps TestGen installation and demo setup steps.
Data Journey overview
We start with a view of all today's Data Journeys. In this view, you can see four different Data Journeys in the UI populated from the demo script.
How to:
- Log in to DataOps Observability (note: the URL and credentials are printed at the end of the installation)
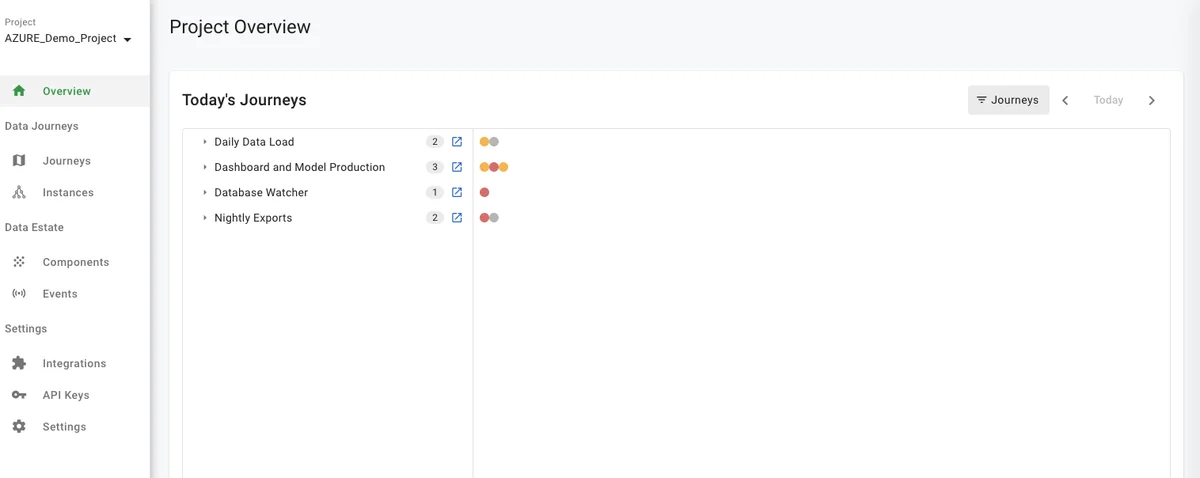
- On the left navigation bar, click 'Instances' (see below)
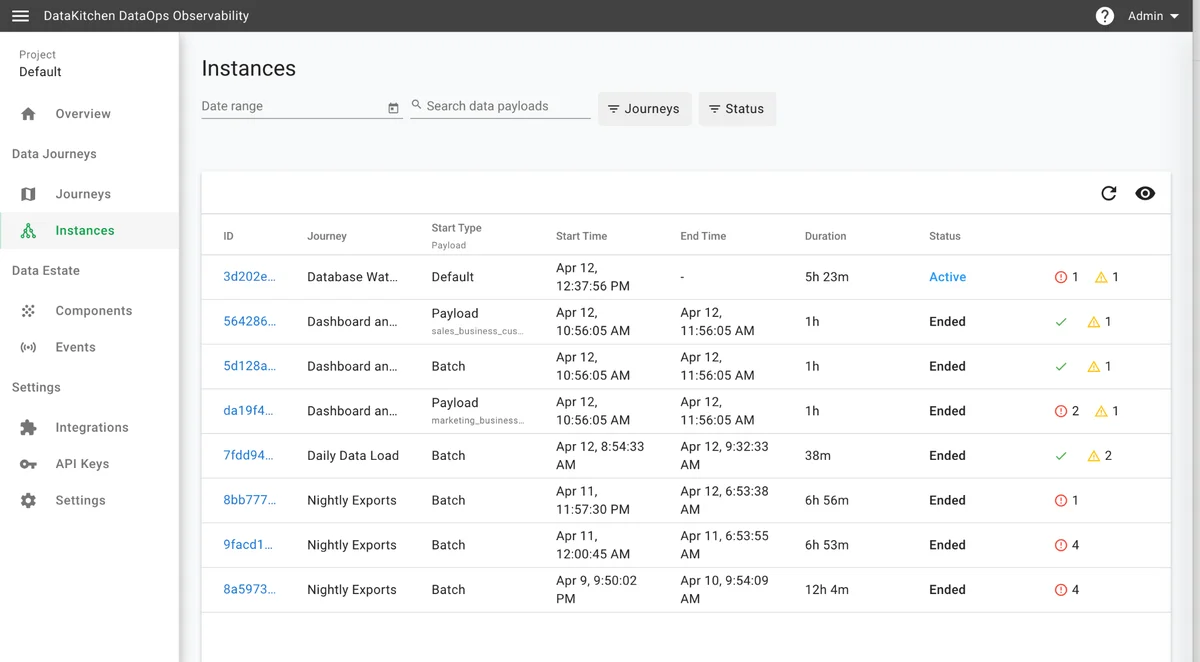
- Then, click on the 'Dashboard and Model Production Data Journey' with a Start Type = Batch (see below). Here, you see four components of the Data Journey, their required order, and status information.
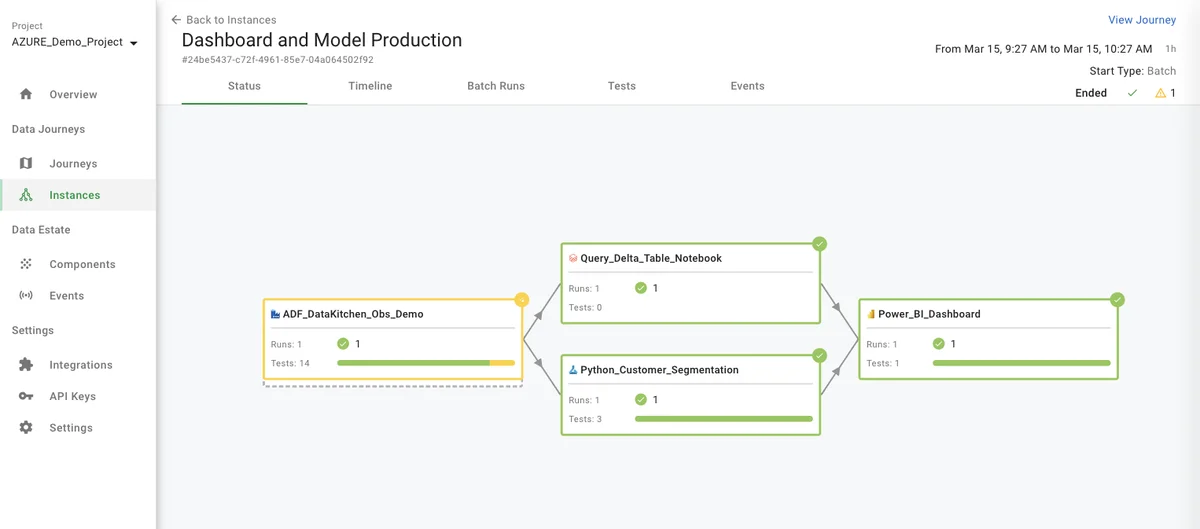
- Click on the 'Timeline' tab, and you will see a Gantt chart showing each component's run time and execution time.
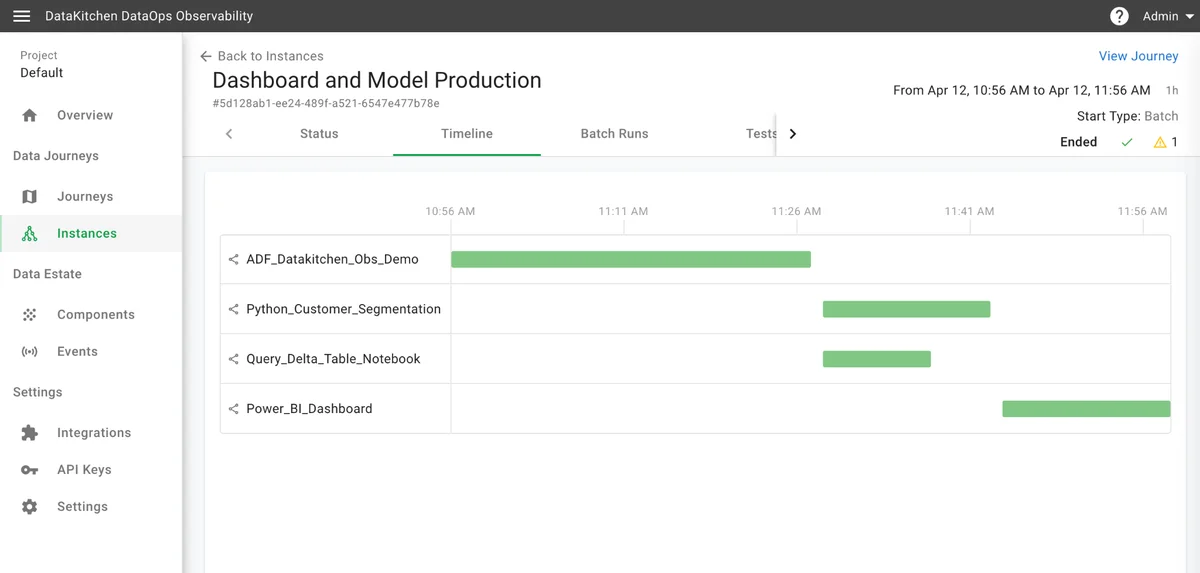
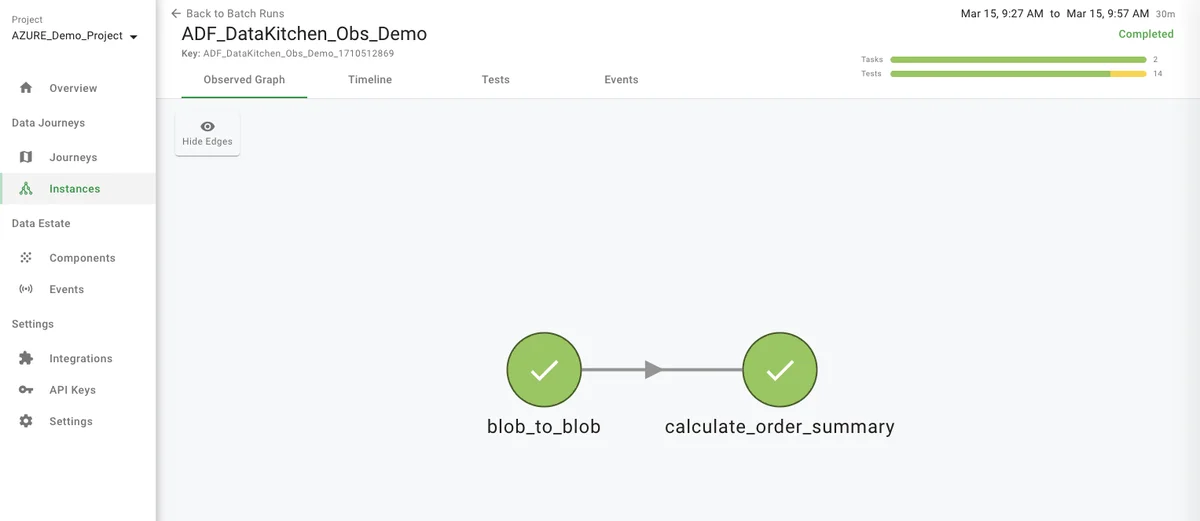
- When you click on the 'ADF_DataKitchen_Obs_Demo' component's green bar, you will see the 'observed graph' of each component's steps.
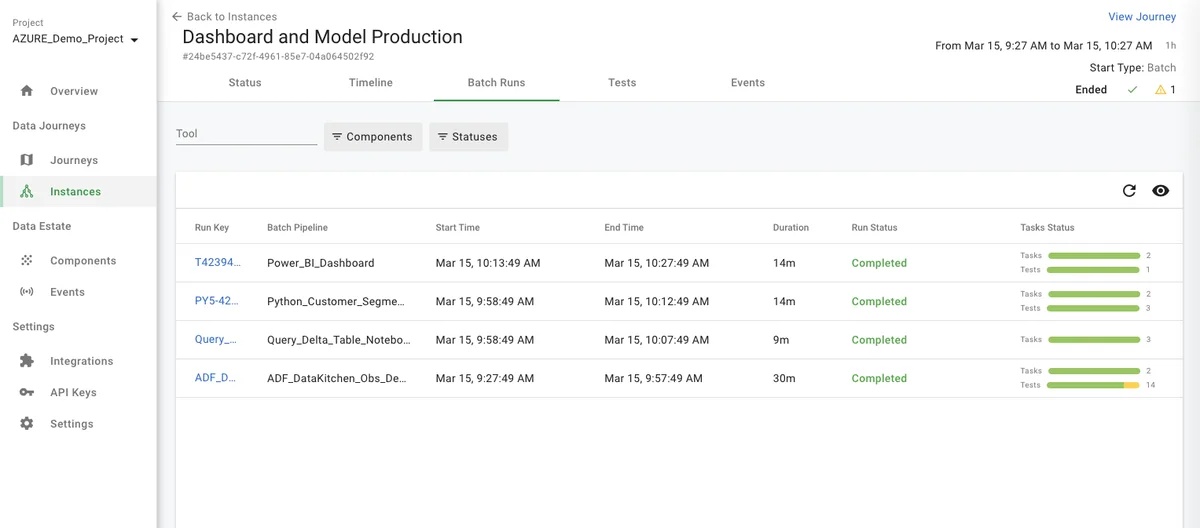
- From that point, if you click on the upper left, '<- Back to Batch Runs,' you will see a list of each component's batch run instance.
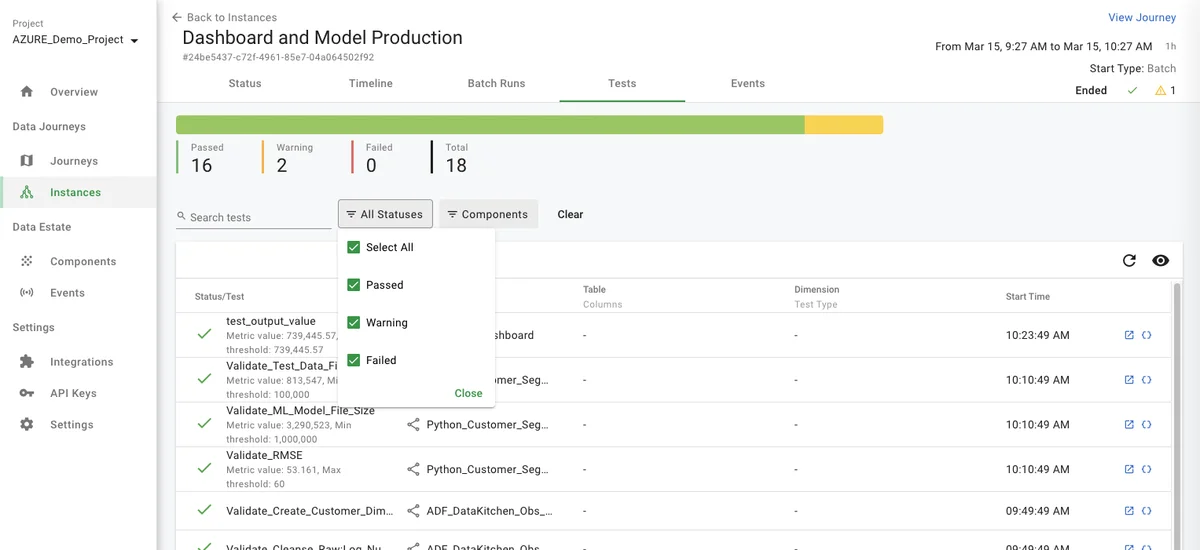
- From the batch runs page if you click the 'Tests' tab toward the middle of the UI, you will see a listing of the data test for every component in the journey and their results.
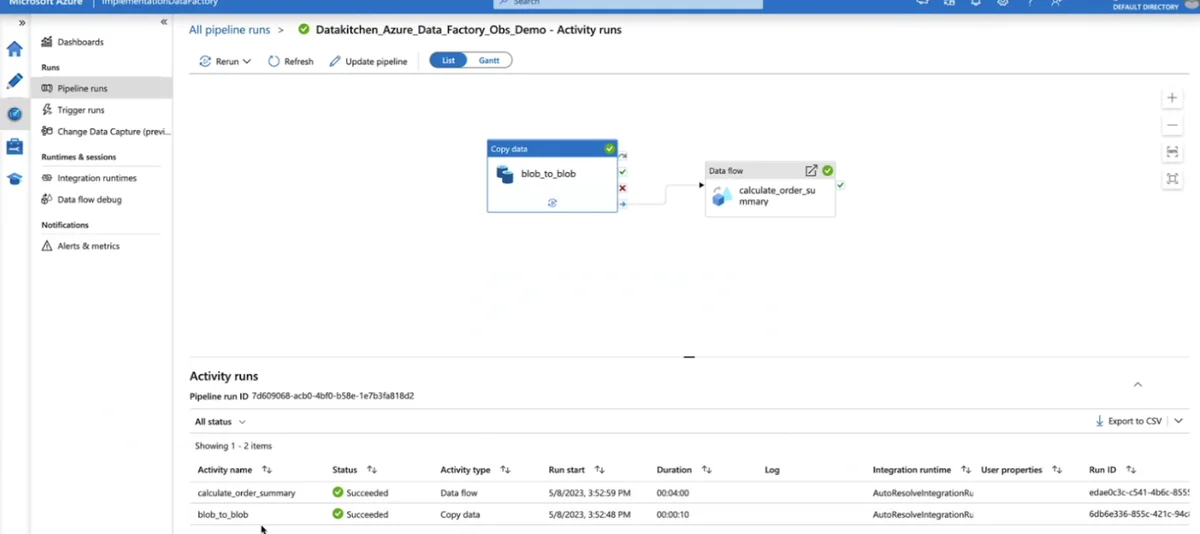
- If the Agent integration supports this feature and you have proper credentials, you will be able to jump directly from the event/error into the tool and/or job that caused the error by clicking on the square "Open external source" icon on the right side of the UI.
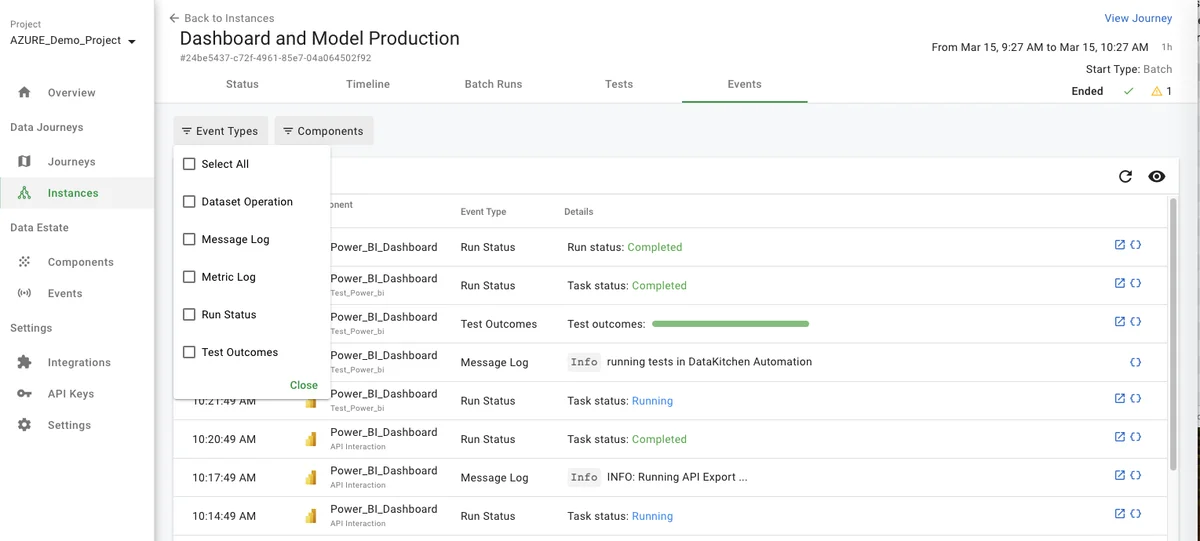
- Returning to the top of the page in DataOps Observability, you can click on the 'Events' tab on the instance page. This will take you to a list of all the events collected for that Data Journey Instance. You can filter the events by status and component.
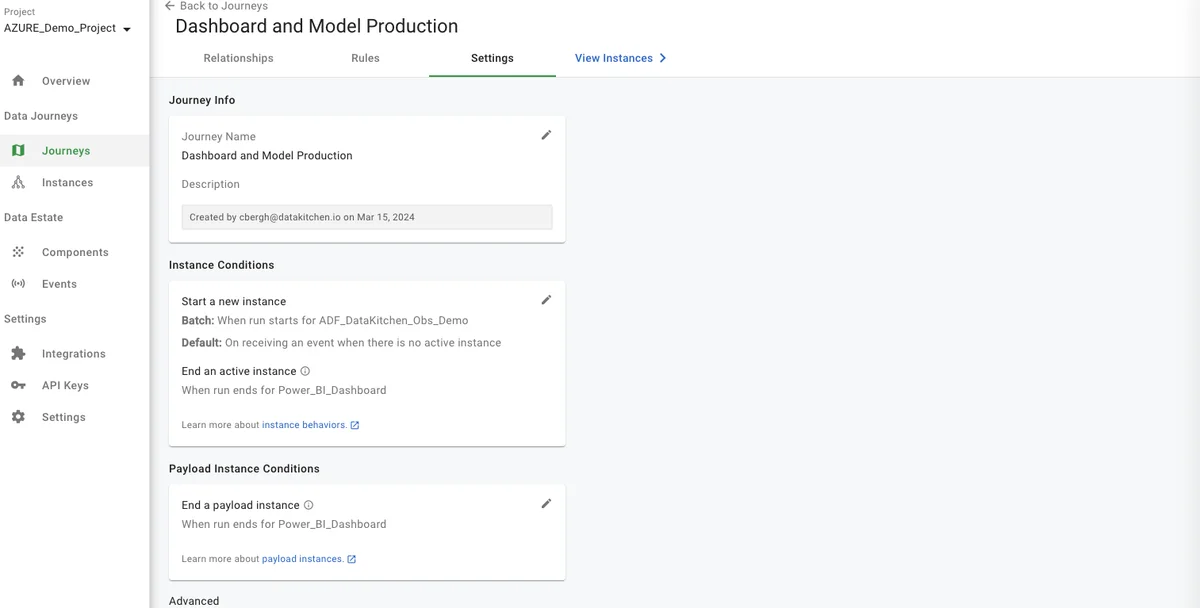
- How does the Data Journey create a Data Journey Instance? A series of instance conditions group the flow of events coming into each component into an instance. To see them:
- Click on the Journeys section on the left of the UI
- Pick the "Dashboard and Model Production" Journey
- Click on the "Settings" tab at the top.
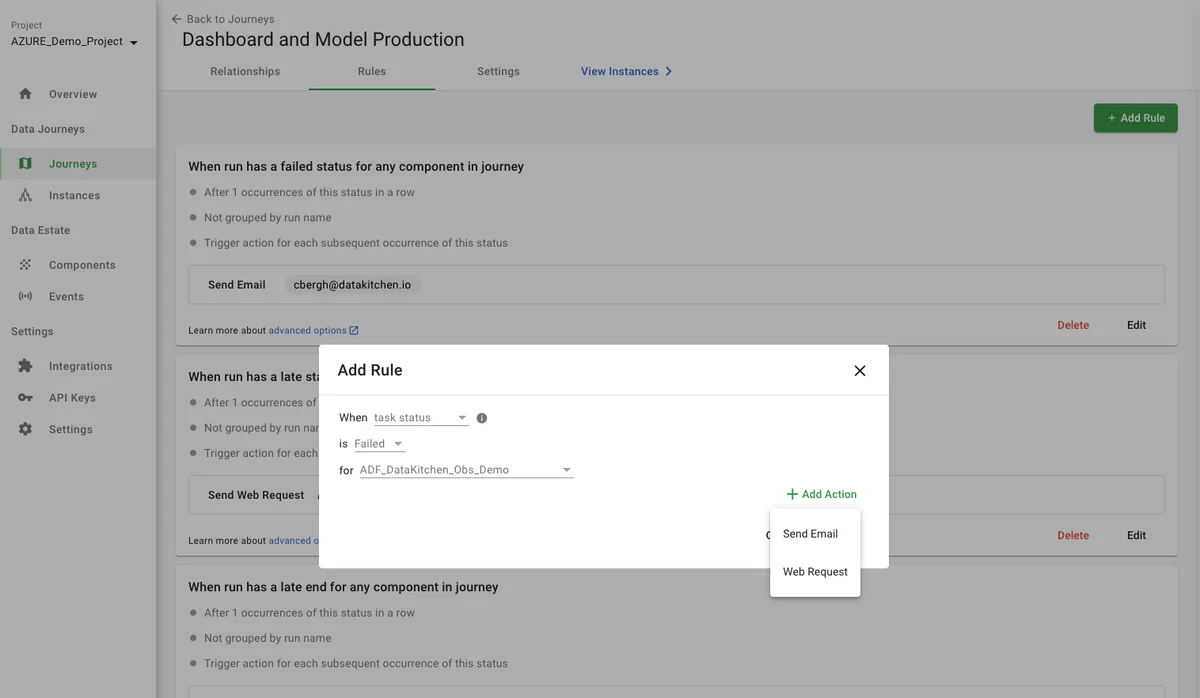
- How do you send alerts? Each Data Journey has a UI for setting up rules to alert by email or webhook.
- Click on the "Rules" tab
- Click the "+ Add Rule" button
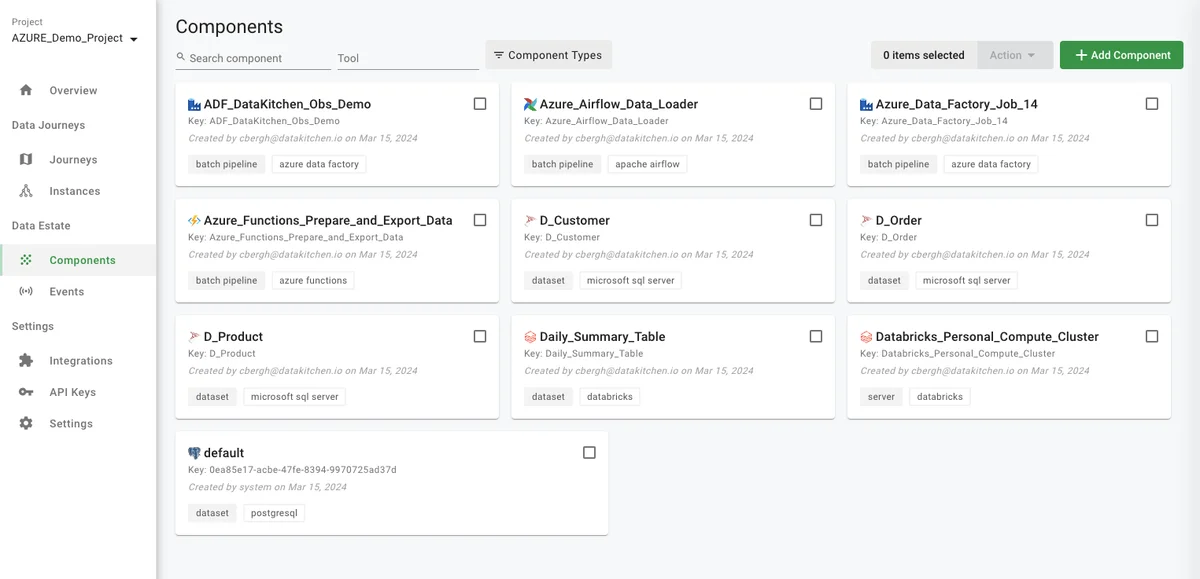
- Where are the available components that can be used in a Data Journey? To find out:
- Click on the 'Components' link in the left navigation area.
Benefits
DataKitchen's DataOps Observability detects, localizes, and provides a shared context so problems can be understood and acted upon immediately.
In a world of complexity, failure, and frustration, data and analytics teams need to deliver insight to their customers with no errors and a high rate of change. You don't have to live with these problems. DataKitchen DataOps Observability provides the solution.
The critical feature — support for data journeys — allows monitoring of every data process from source to customer value. Production expectations reduce embarrassing errors to zero, including data and tool testing. Development cycle data validation and tool testing increase the delivery rate and lower the risk of deploying new analytic insights. Historical dashboards enable you to find the root causes of issues and constantly improve. An intuitive, role-based user interface allows all stakeholders to be on the same page. Off-the-shelf integrations and an open API enable fast implementations without replacing your existing tools.
When you aim to produce rapid, trusted customer insight, you need to start by reducing your team's hassles and embarrassment while increasing the time it has to develop and deliver. Monitoring all data journeys can lower error rates and help you achieve your goals. Keep your tools and infrastructure the same; use the DataKitchen DataOps Observability product on top of those tools.
By observing every data journey and taking early action to stay on track, you can spend less time worrying about what may go wrong and gain more time to create.
Next steps
Our following tutorial is Part 4: Integrate Your ToolChain Quickly. It will give you an idea of how to integrate DataOps Observability into your toolchain.