Integrate Your ToolChain Quickly
"Plug-In: Who Watches the Watchmen?"
Your challenge
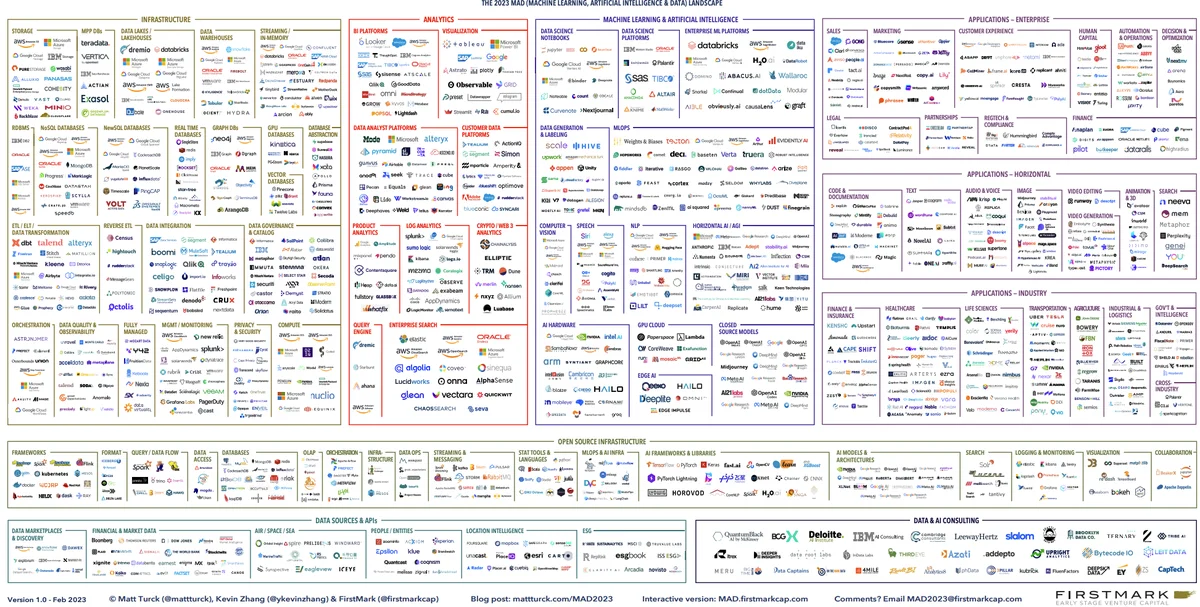
There are just a few data and analytic tools on the market. For example, in Matt Turk's Data Tool landscape for 2023, he has 1,416 logos appearing on the landscape. For comparison, there were 139 in their first version in 2012. That's a lot of tools. Any of them can fail during production or act upon data unexpectedly to provide wrong insight to your customers. Typical data shops will have dozens of discrete tools that are separate or embedded within another larger platform.
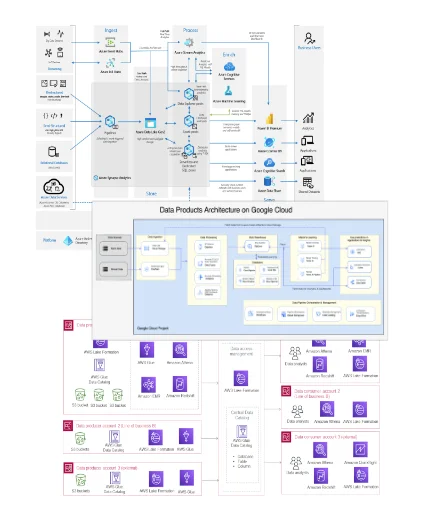
All those little tools end up being boxes on your data architecture diagram. During production, those little boxes must run at specific times, in a specific order, and with the correct data in and out of each box. You need something to ingest events from the tools and assets in your data estate. Then, it correlates and filters this information to display and alert you to the status of your operations and the problem areas that require action. You need to connect each box via its API to a complete picture of your data journey.
Tutorial goal and methods
Our goal for this tutorial is for you to understand how data is integrated into DataOps TestGen and Observability. This involves connecting TestGen to data and both TestGen and Observability Agents into DataOps Observability.
Background
How can you trust the tools? How can you integrate those tools into a Data Journey to make a coherent sense of your production process?
You have to look both at data in place and data in use. Data in Place refers to the organized structuring and storage of data within a specific storage medium, be it a database, bucket store, files, or other storage platforms. In the contemporary data landscape, data teams commonly utilize data warehouses or lakes to arrange their data into various layers. Data in Use pertains explicitly to how data is actively employed in business intelligence tools, predictive models, visualization platforms, and even during export or reverse ETL processes. These applications are where the rubber meets the road and often where customers first encounter data quality issues. Problems can manifest in various ways, such as Model Prediction Errors in machine learning applications, empty dashboards in BI tools, or row counts in exported data falling short of expectations.
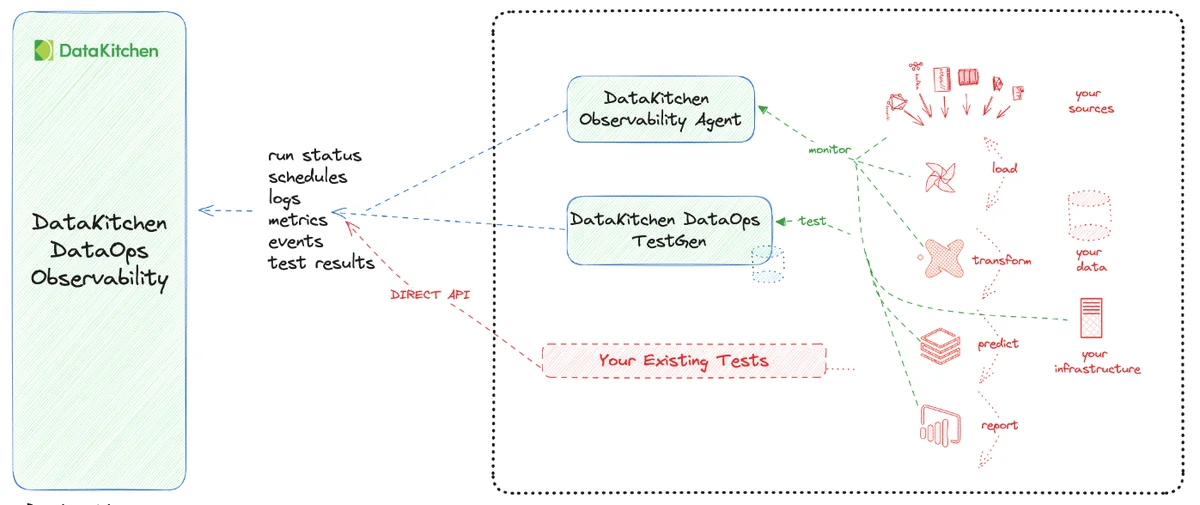
DataKitchen's DataOps TestGen Tool focuses on checking database data via SQL connections. Our DataOps Observability focuses on collecting data through APIs and Agents that talk to the tools you are using in your data architecture.
Step-by-step guide
Setup
You should have gone through all the DataOps Observability and DataOps TestGen installation and demo setup steps.
Creating an Observability API Key
To connect to the Observability, you need to generate an API key that can connect TestGen, Observability Agents, or any program to the Observability API.
How to:
- Log in to DataOps Observability (note: the URL and credentials are printed at the end of the installation)
- On the left navigation bar, click 'API Keys' (see below)
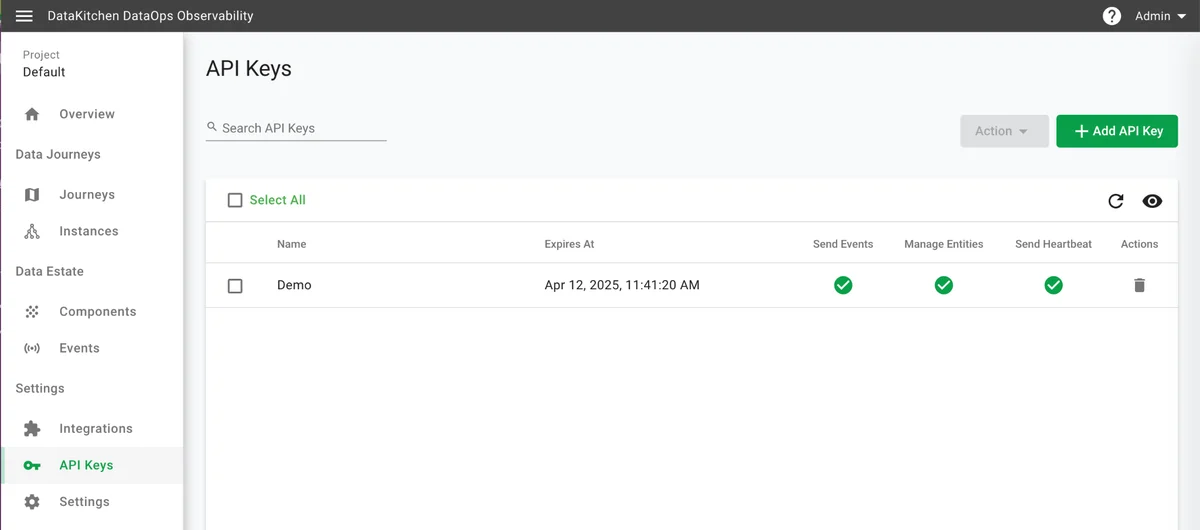
- On the upper right, click "+ Add API Key."
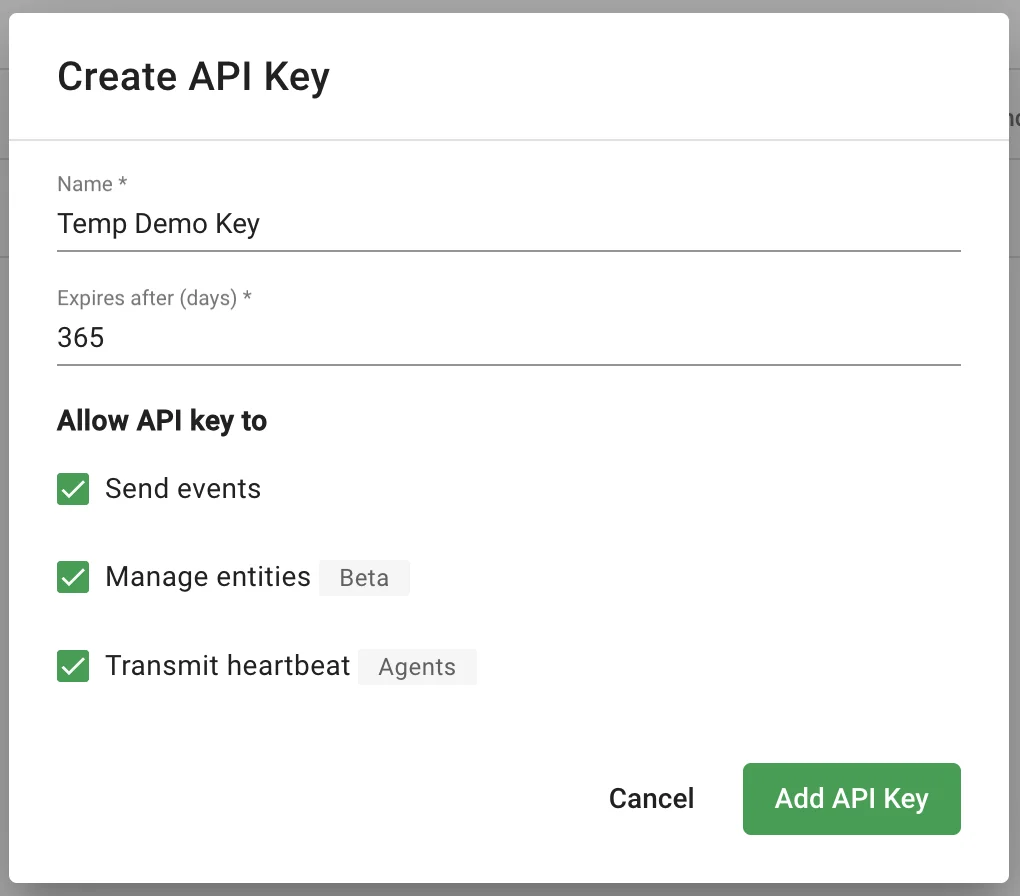
- A form pops up, fill out the name and duration in days, and click all three check boxes (see below)
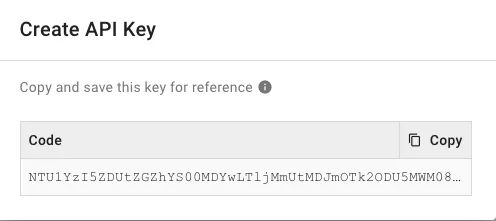
- Another window pops up with the API key (see below). Please copy and save the API Key. You will not have the opportunity to view it again. This API is used to connect to the DataOps Observability API via Observability Agents, DataOps TestGen, or your own programs.
Data In-Place: Data quality testing integration
Integrate and test your database by setting up Connections With DataOps TestGen. As you saw in tutorials 1 through 3, TestGen connects your data to profiles, then generates and finally executes data quality validation tests. The results of those tests are available in the TestGen UI. However, data test results should be included in DataOps Observability to see issues in complete context and for sharing and alerting.
How to:
- Log in to DataOps TestGen (note: the URL and credentials are printed at the end of the installation)
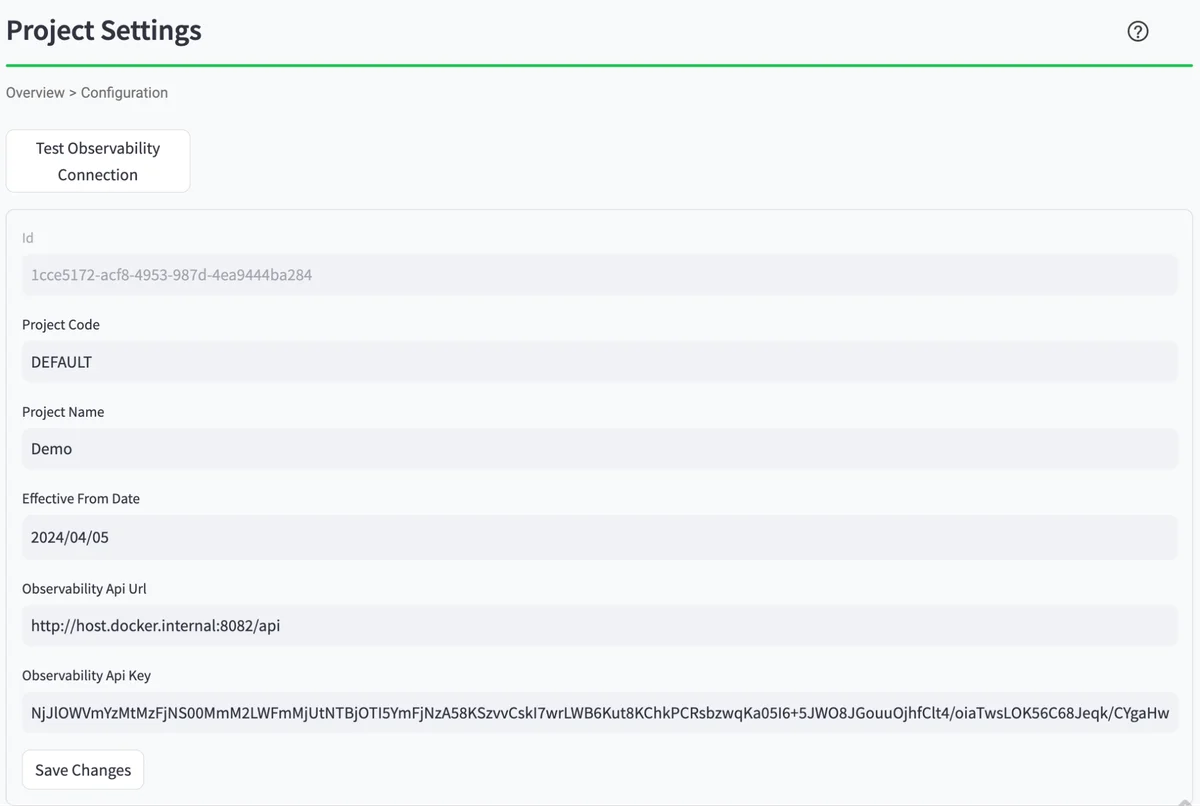
- Click on 'Configuration' in the Navigation Bar
- The connection information for DataOps Observability should be at the bottom of the screen. It was added during the demo setup.
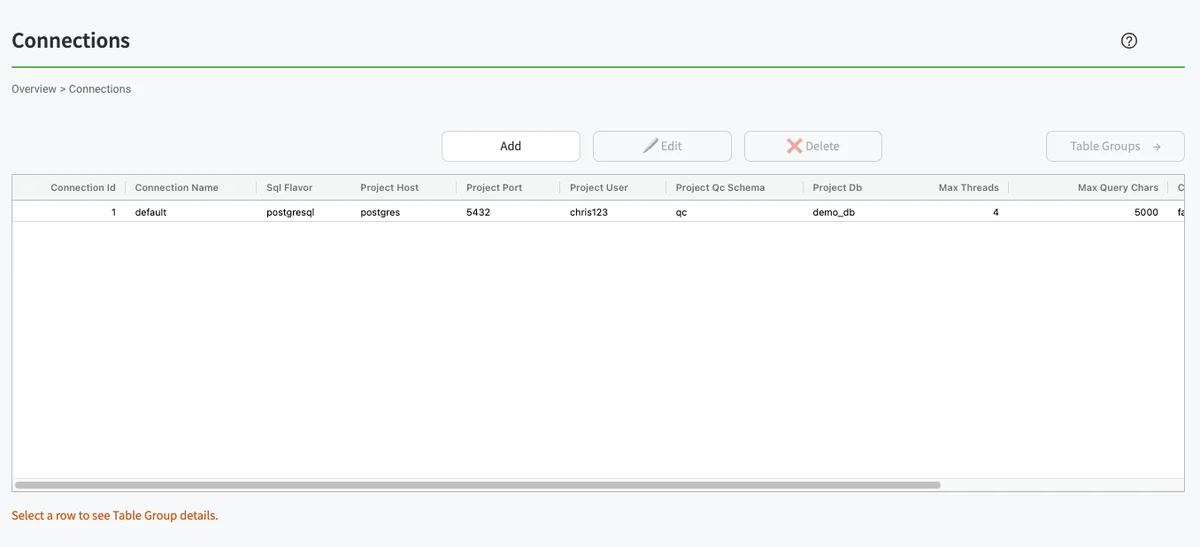
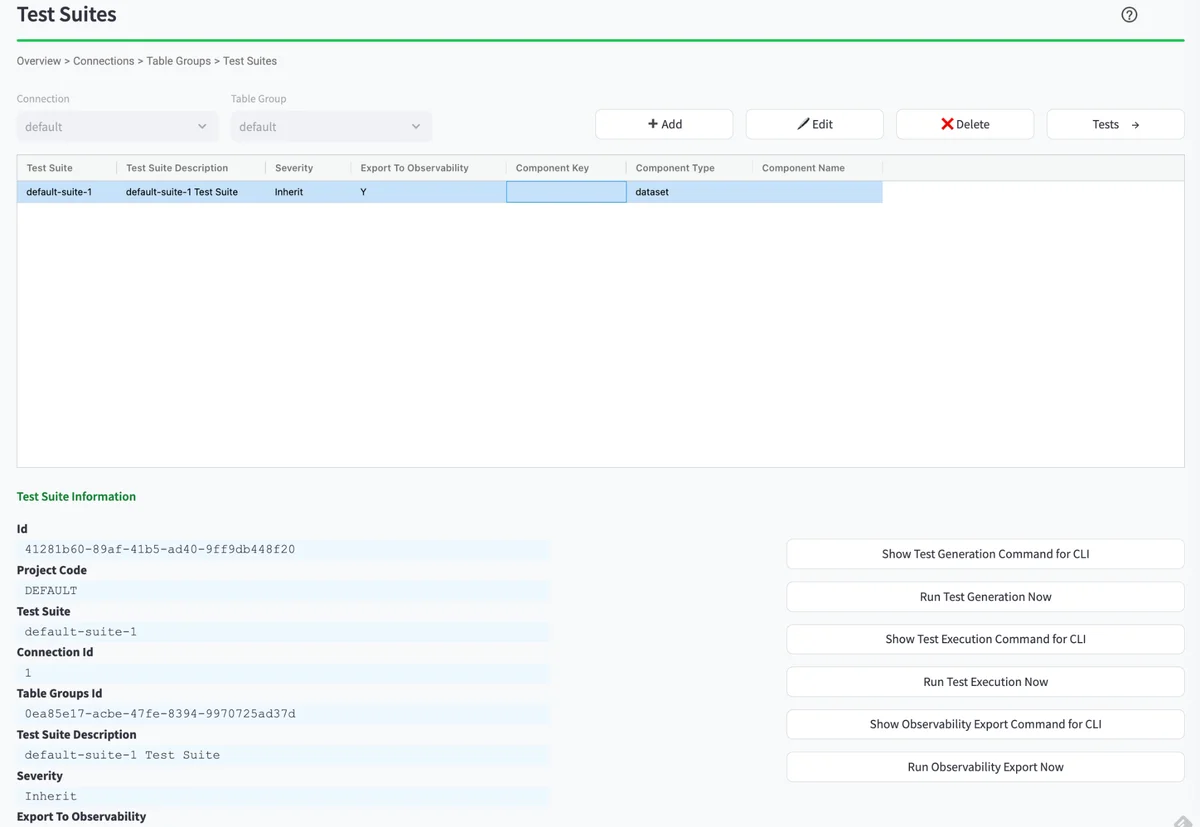
- To manually send the test results to DataOps Observability, press 'Connections' on the navigation bar. You will see the UI below. From there, highlight the first row in the table, then click the 'Table Groups' button on the right.
- You should see the 'Test Suites' table in the UI (see below). From there, highlight the first row in the table. You will then see a series of buttons appear below the table on the right. You will need to hit the button 'Run Test Execution Now,' followed by hitting the 'Start' button. After a few moments, you can hit the 'Run Observability Export Now' button, followed by the 'Start' button. This will send the latest test results to the default component in DataOps Observability.
Data In-Use: Integration
Two other methods exist to send data about your data estate into DataOps Observability.
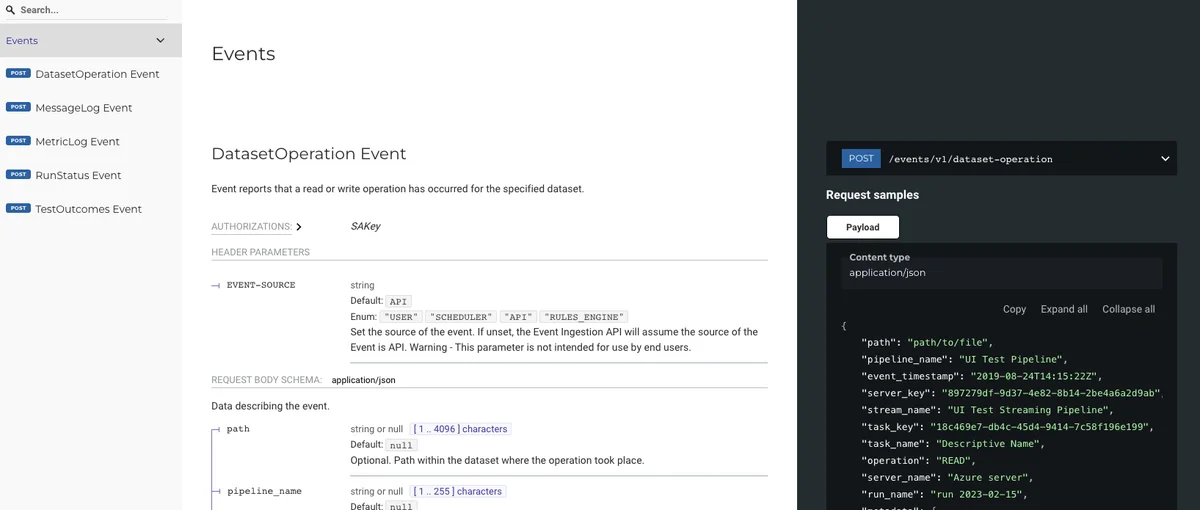
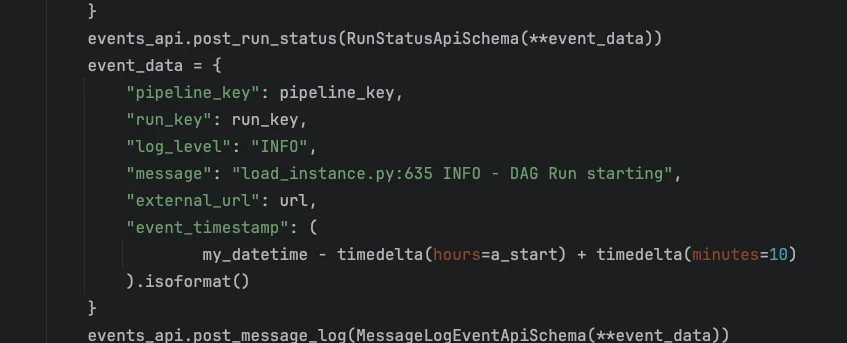
The first method is to integrate your tools by sending them directly to the event API or directly by Python.
The second method is to integrate your tools via an existing DataOps Observability Integration Agent. The UI shows a list of available agents.
How to:
- Log in to DataOps Observability (note: the URL and credentials are printed at the end of the installation)
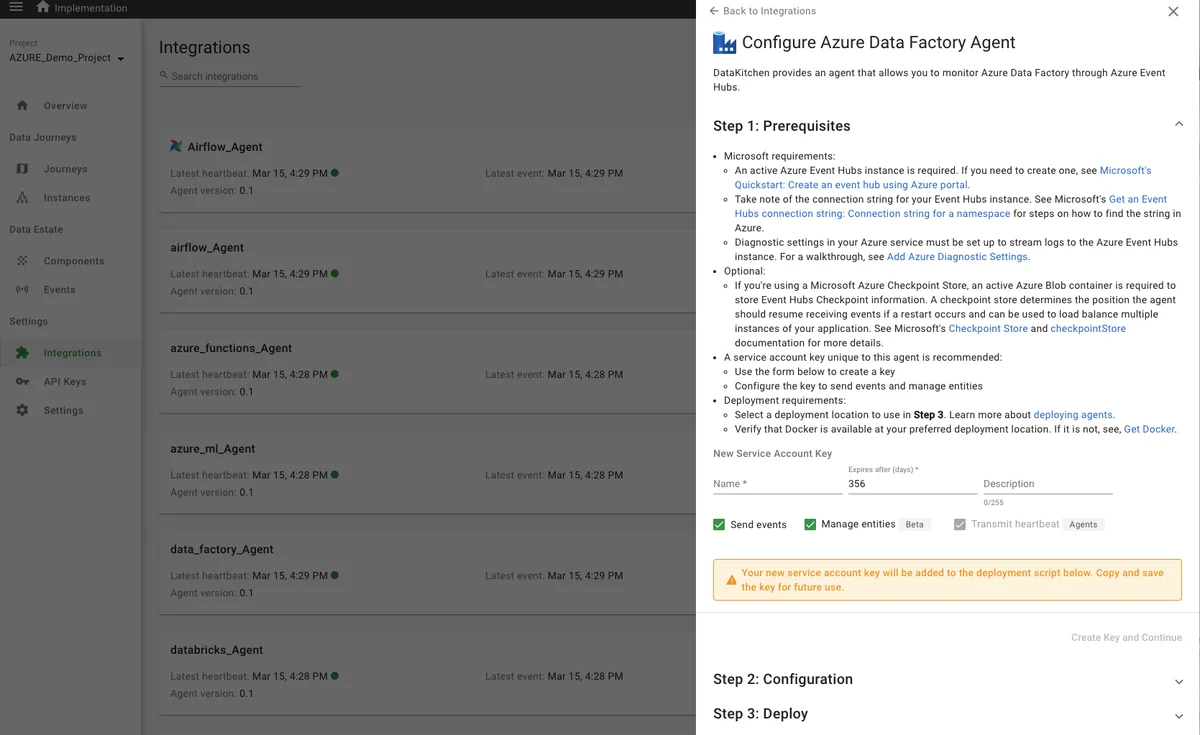
- Click on 'Integrations' in the Navigation Bar, then click the 'View Available Integrations' in the upper right of the page. Then, click (as an example) the Azure Data Factory Agent. You will see information about downloading and configuring the agent on the right (see below)
- If an agent is not available for your existing tool, you can create one by extending the framework at our GitHub repo at https://github.com/DataKitchen/heimdall-agents
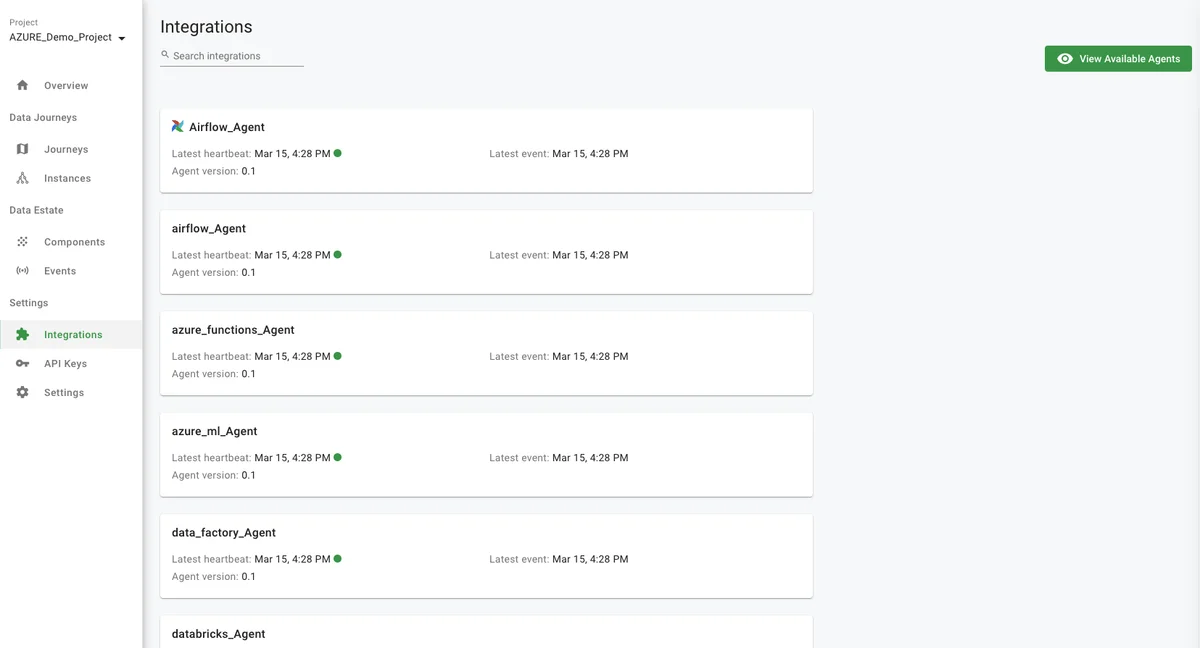
- The demo provides a way to see the status of agents. To do this, you will need to run a command line argument from the directory you used to run the
dk-installer.pyprogram. Execute the following command:python3 dk-installer.py obs run-heartbeat-demo - These agents, of course, are not running, but the demo program simulates a heartbeat API event that our Agent framework provides. Find the Status of your Agents in the DataOps Observability UI. Just click on 'Integrations' from the navigation bar:
Benefits
Testing data in place (in a database) and data in use (in your data architecture toolchain) provides the complete picture to ensure your production data work is timely, accurate, and trusted.
Next steps: How can I do this on my data right now?
We recommend that you start connecting DataOps TestGen to your data, profiling your data, generating tests, and setting up the export of those tests to a data journey in DataOps Observability. We then recommend installing an Observability Agent against an existing tool (e.g., Airflow) and having that automatically send events into Observability. Connect the two created components to your Data Journey!